
Figures & data
Figure 1. Long Short-Term Memory Network structure.
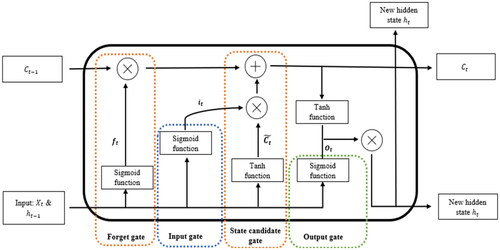
Table 1. Long Short-Term Memory Network (LSTM) formula.
Figure 2. Minimised the impact of comorbid conditions with similar symptoms in (a) Australia and (b) New Zealand, respectively. The pink area represents the search range for comorbidities with similar symptoms. Specifically, the comorbid conditions with similar symptoms were estimated using data collected during the non-COVID-19 period, from 6th January 2019 to 10th October 2019. Meanwhile, the blue area in the graph represents the COVID-19 related search.
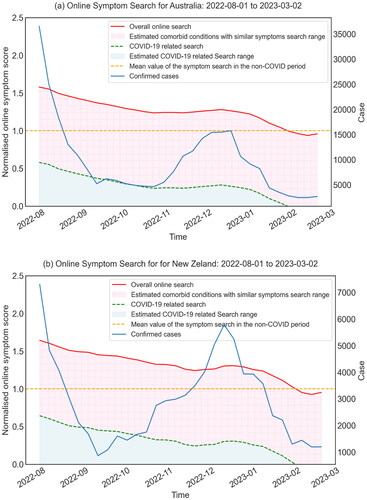
Figure 3. Estimated components of COVID-19 symptom search in Australia and New Zealand with (a) (c) the quantile 10–90 scenario, (b) (d) the quantile 25–75 scenario, respectively. The green area represents minimal media influence on symptom search, while the grey area represents minimal infected person-led symptom search. The pink area in the figure represents the uncertainty zone, bounded by the lower and upper bounds of media-influenced symptom searches, which visualises the dynamic impact of media coverage on online symptom searches and highlights the range of uncertainty in the analysis.
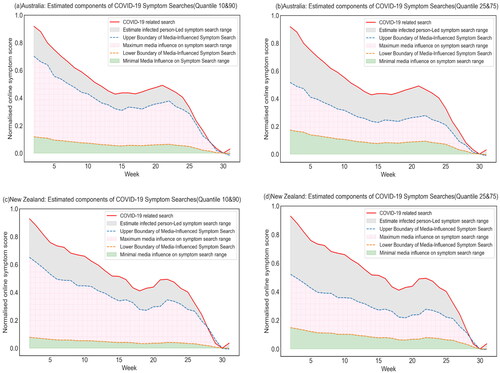
Figure 4. Estimation of COVID-19 cases using the proposed method with the RNN-LSTM embedding model for (a) Australia and (b) New Zealand for the 10–90 and 25–75 quantile scenarios.
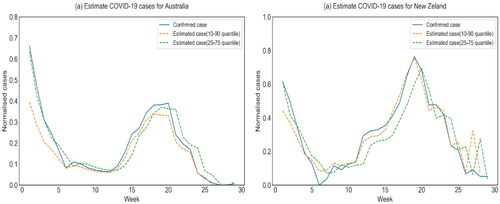
Table 2. Results of model evaluation.