Figures & data
Table 1. Demographic and laboratory data.
Figure 1. Calculated free beta-lactam trough concentration divided by MICECOFF for piperacillin (○), meropenem (□) and cefotaxime (◊) versus relative eGFR* (mL/min/1.73 m2) presented with (a) a normal and (b) a logarithmic y-axis.MIC: Minimum inhibitory concentration, eGFR: estimated glomerular filtration rate, ECOFF: Epidemiological cut-offs. Lower line equals 1xMIC, higher line equals 4 × MIC.*Calculated with Chronic Kidney Disease Epidemiology Collaboration (CKD-EPI).
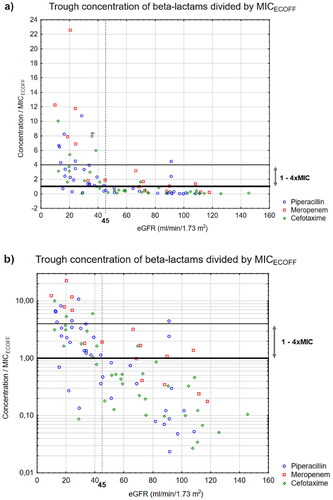
Figure 2. ROC analysis with CI95% of insufficient exposure to piperacillin, meropenem and cefotaxime based on (a): relative eGFR* (mL/min/1.73m2) and (b): absolute eGFR* (mL/min). ROC: Receiver Operation Characteristic, CI95: 95% Confidence Interval, eGFR: Estimated glomerular filtration rate, PIP: Piperacillin/Tazobactam, MER: Meropenem, CTX: Cefotaxime, AUC: Area Under the Curve.*Calculated with Chronic Kidney Disease Epidemiology Collaboration (CKD-EPI).
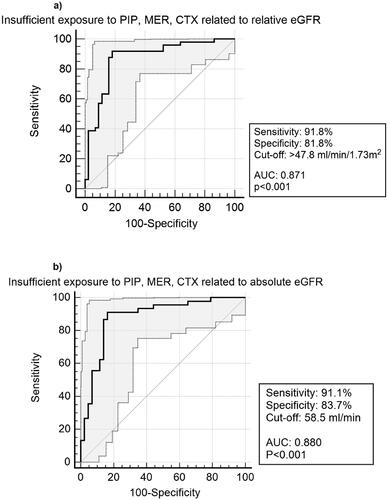
Table 2. Predictive power of insufficient exposure based on eGFR with different cut-off valuesTable Footnote*.
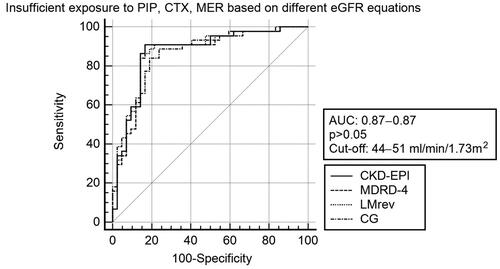
Figure 3. ROC-curves for prediction of insufficient exposure* with different relative eGFR equations**. eGFR: Estimated glomerular filtration rate, ROC: Receiver Operation Characteristics, AUC: Area Under the Curve, CKD-EPI: Chronic Kidney Disease Epidemiology Collaboration, MDRD-4: Modification of Diet in Renal Disease – 4 item, LMrev: Lund-Malmo revised, CG: Cockcroft-Gault. *Trough concentration ≤ MICECOFF (Epidemiological cut-offs of minimum inhibitory concentrations) between dose intervals. **mL/min/1.73m2.