
Figures & data
Figure 1. Timeline of changes in vaccination coverage, border changes and masking requirements with the number of daily COVID-19 case notifications (orange) with seven day moving average and number of SA2s with recorded cases (blue).
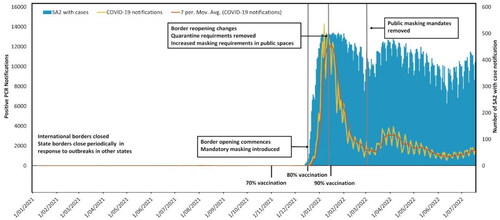
Table 1. Phase details of Queensland government state and international border closures and restrictions based on population vaccination targets of 70%, 80% and 90% and recommended masking requirements.
Figure 2. Scatter plots with regression line for daily COVID-19 cases (green) and SA2 regions (blue) by phase of border opening (A, B) and masking levels (C–E) from 13 December 2021 to 19 July 2022.
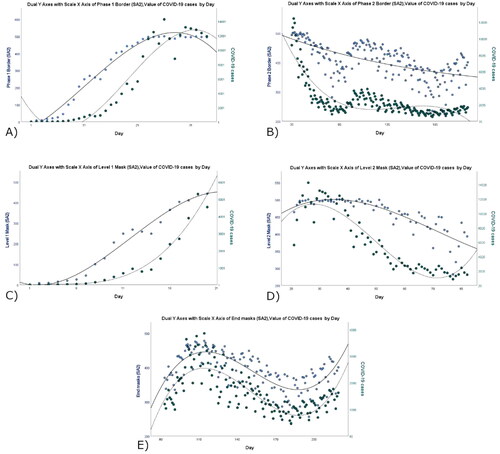
Figure 3. Percentage of the population having received two doses of COVID-19 vaccine by SA3 region at vaccination target thresholds. Left to right: 70% state population coverage (15 November 2021), 80% state population coverage (13 December 2021) and 90% state population coverage (17 January 2022).
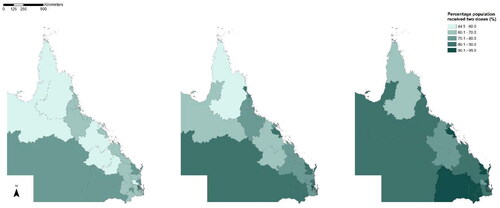
Figure 4. COVID-19 incidence per 100,000 population per 100 days by border closure phases for Queensland (A: phase one, B: phase 2 and C: phase 3; D–F: SEQ detail).
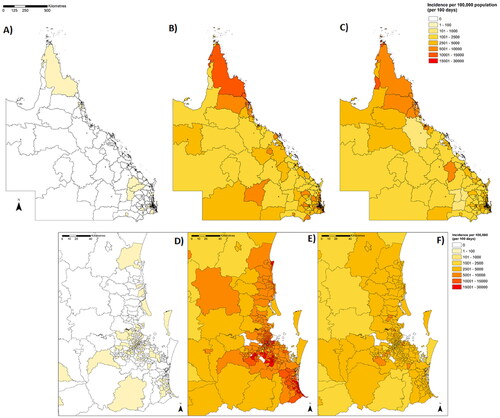
Figure 5. COVID-19 incidence per 100,000 population per 100 days by masking requirements for Queensland (A: level 1, B: level 2 and C: level 3; D–F: SEQ detail).
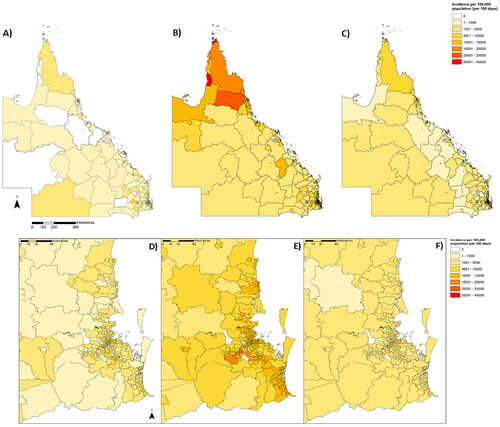
Figure 6. Relative risk by SA2 with MLC by border restrictions in Queensland with details for SEQ (A: phase one, B: phase 2 and C: phase 3) showing clusters by area (cluster outline) and proportional to population (blue gradient and diameter).
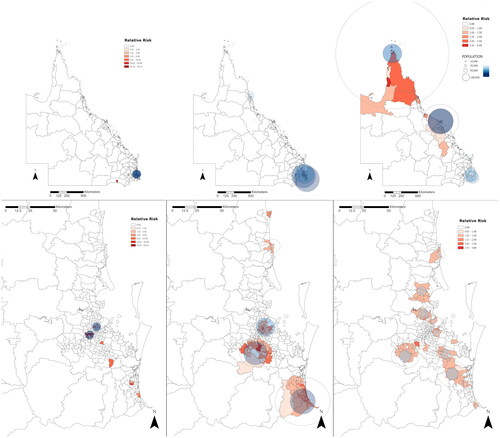
Table 2. Details of most-likely clusters (MLC) of COVID-19 infection by intervention phase.
Figure 7. Relative risk by SA2 with MLC by masking levels in Queensland with details for SEQ (A: phase one, B: phase 2 and C: phase 3) showing clusters by area (cluster outline) and proportional to population (blue gradient and diameter).
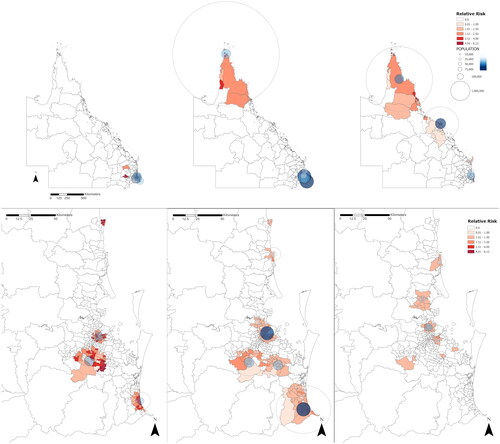
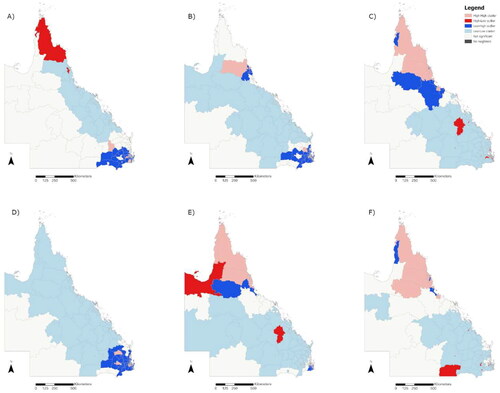
Figure 8. Map showing cluster and outlier analysis by intervention phases, border (A–C) masking (D–F), showing unusual outliers as high-low or low-high and clusters as high-high or low-low.
Supplemental Material
Download MS Word (1.4 MB)Data availability statement
The data that support the findings of this study are from publicly available sources. COVID-19 incidence data for Queensland, Australia are available from the COVID-19 Resources Open Data Portal from the Queensland Government repository (CC BY 4.0) (https://www.data.qld.gov.au/dataset/queensland-covid-19-case-line-list-location-source-of-infection/resource/1dbae506-d73c-4c19-b727-e8654b8be95a) [Citation54]. All Australian SA2 population estimates data for 2021–2022 are available for download from the Australian Bureau of Statistics (ABS) data repository (CC BY 4.0) (https://www.abs.gov.au/statistics/people/population/regional-population/2021-22/32180DS0001_2021-22r.xlsx) [Citation55].