Figures & data
Figure 1. Task-oriented portfolio instructional setting.
Figure 2. Phases and processes of self-regulation.
Figure 3. Target grade setting visualization.
Figure 4. (a) Task list showing workload for a pass grade. (b) Task List showing work for a High Distinction grade.
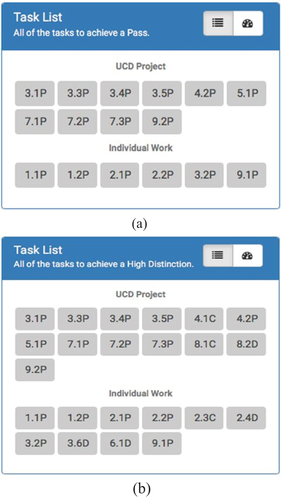
Figure 5. A tornado chart showing the usage and usefulness rating for Target Grade Setting.
Figure 6. Task list using colours to show task statuses.
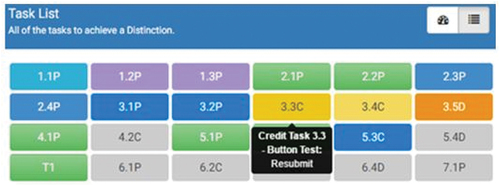
Figure 7. Focus list showing tasks to keep student on track.
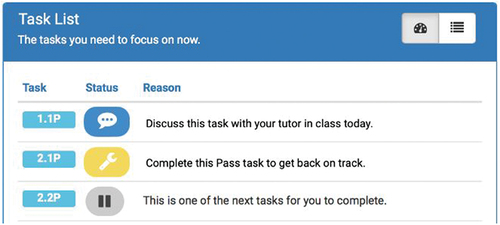
Figure 8. Burndown chart is designed to help students to self-assess their progress.
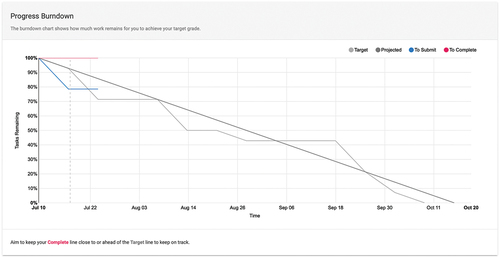
Figure 9. Task summary chart showing summary of task statuses for an individual student.
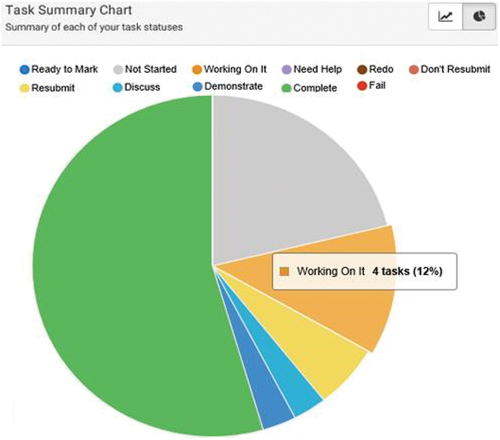
Figure 10. Outcome alignment and achievement chart presenting information about individual and group LO achievements.
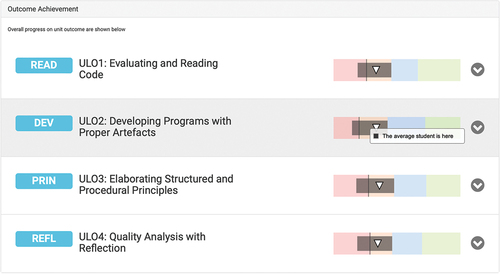
Figure 11. Outcome alignment and achievement task view showing links between learning outcome and tasks.
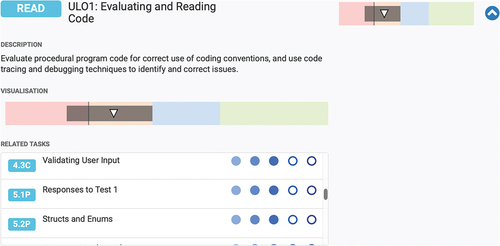
Figure 12. User usage and usefulness rating for OLM visualizations in monitoring performance.
Figure 13. Task alignment rating for facilitating student self-reflection.
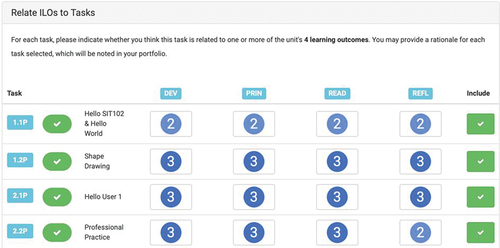
Figure 14. User usage and usefulness rating for the task alignment rating.