
Figures & data
Figure 1. A + B: pure tone audiogram of right (red) and left (blue) ear, air and bone conduction. A: audiogram at initial consultation: hearing thresholds within normal limits, slight decrease in mid and high frequencies on the left side compared to the right side. B: follow-up audiogram after 4 weeks: bilateral asymmetric sensorineural hearing loss.
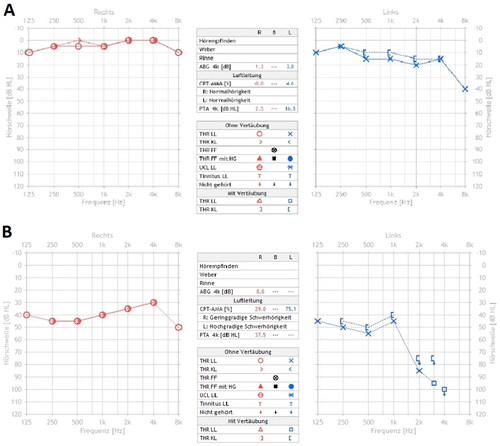
Figure 2. A: Video head impulse test: loss of function of all six semicircular canals on both sides. B: Air caloric stimulation (warm and cold): missing response on both sides.
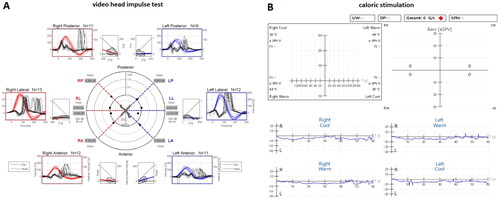
Figure 3. Audiometric follow-up of both ears for 24 months (Jan 2019 – Jan 2021) (x-axis), given in PTA [0.5–4 khz; dBHL] (y-axis) for each ear – red: right; blue: left. Arrows mark the initiation of each therapeutic agent.
![Figure 3. Audiometric follow-up of both ears for 24 months (Jan 2019 – Jan 2021) (x-axis), given in PTA [0.5–4 khz; dBHL] (y-axis) for each ear – red: right; blue: left. Arrows mark the initiation of each therapeutic agent.](/cms/asset/92e4eecc-3734-4b1b-9330-70c6ec0817ac/icro_a_2176309_f0003_c.jpg)
Table 1. Performed diagnostic procedures.
Table 2 Applied therapies including dose, duration, and type of administration.