
Figures & data
Figure 1. Brain CT Scan (A) No pathological inter- and extra-axial findings that could explain the patient’s neuro-ophthalmological symptoms were observed in the axial CT scan images of the brain. (B and C) Evidence of proptosis was found in the right orbit. Proptosis is diagnosed in cross-sectional images by measuring the distance between the anterior and posterior edges of the globe to the intrazygomatic line (green line) at the level of the lens and optic nerve head. The upper limit of the normal distance is 21 mm, and any distance greater than 21 mm indicates proptosis [Citation11]. The lower limit of the normal distance between the intrazygomatic line and the posterior edge of the globe (yellow line) is 5.9 mm, and any distance less than 5.9 mm also indicates proptosis [Citation12]. In the axial CT scan images of the patient taken at the level of the lens and the optic nerve head on the right side, the distance between the anterior edges of the globe to the intrazygomatic line (red line) was 21 mm and the distance measured between the intrazygomatic line and the posterior edge of the globe (yellow line) was 4.9 mm (B). Due to the patient’s rotation for comparing the two eyes in a same-plane cut with a bilateral lens, evidence of a more anterior position of the right globe compared to the left was observed (C).
![Figure 1. Brain CT Scan (A) No pathological inter- and extra-axial findings that could explain the patient’s neuro-ophthalmological symptoms were observed in the axial CT scan images of the brain. (B and C) Evidence of proptosis was found in the right orbit. Proptosis is diagnosed in cross-sectional images by measuring the distance between the anterior and posterior edges of the globe to the intrazygomatic line (green line) at the level of the lens and optic nerve head. The upper limit of the normal distance is 21 mm, and any distance greater than 21 mm indicates proptosis [Citation11]. The lower limit of the normal distance between the intrazygomatic line and the posterior edge of the globe (yellow line) is 5.9 mm, and any distance less than 5.9 mm also indicates proptosis [Citation12]. In the axial CT scan images of the patient taken at the level of the lens and the optic nerve head on the right side, the distance between the anterior edges of the globe to the intrazygomatic line (red line) was 21 mm and the distance measured between the intrazygomatic line and the posterior edge of the globe (yellow line) was 4.9 mm (B). Due to the patient’s rotation for comparing the two eyes in a same-plane cut with a bilateral lens, evidence of a more anterior position of the right globe compared to the left was observed (C).](/cms/asset/a9d95615-87cf-4221-bd05-54f735b91a73/icro_a_2332591_f0001_c.jpg)
Figure 2. Paranasal sinuses CT scan. (A and B) In the coronal and axial Paranasal sinuses CT scan images of the bone and soft tissue window at the level of the nasopharynx, evidence of asymmetry of the right superolateral wall compared to the left (indicated by arrows) was observed. (C) In the axial CT scan images obtained at the level of the mastoid and middle ear cavity, evidence of effusion was observed in the right mastoid air cells (indicated by arrow number 1) without any evidence of effusion in the middle ear (indicated by arrow number 2).
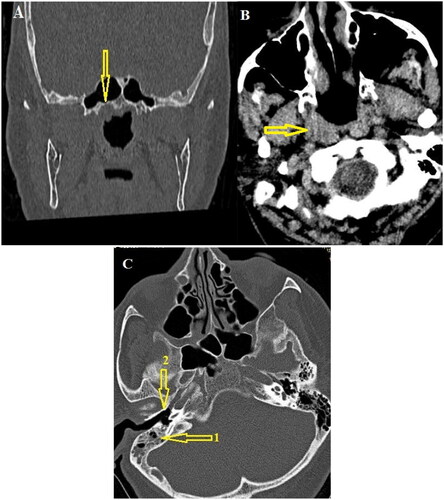
Figure 3. Brain MRI with IV gadolinium injection. (A and B) In the T1- and T2-weighted axial images without contrast at the level of the nasopharynx, minor isosignal asymmetry was present in the nasopharynx (indicated by arrows). (C) In the axial fat-saturated T1-weighted post-gadolinium injection images, evidence of asymmetry of the right lateral wall of the nasopharynx compared to the left wall (indicated by an arrow) with enhancement was observed. (D) In the evaluation of other areas, evidence of prominent right-sided superior ophthalmic vein (indicated by arrow number 1 compared to arrow number 2) with (E) involvement of a small part of the right side of the cavernous sinus (indicated by arrow) was observed. No evidence of invasion into the nasal cavity, paranasal sinuses, or orbit was observed.
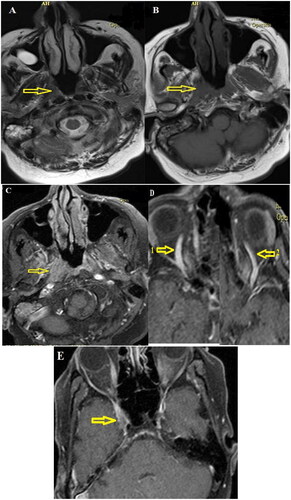
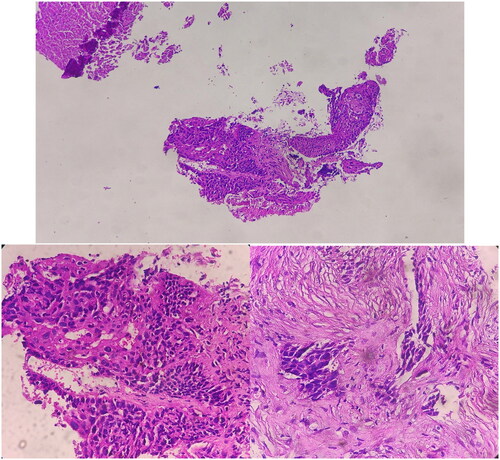
Figure 4. Sections show stratified squamous mucosa and underlying fibrotic tissue involved by malignant neoplastic lesion composed of sheets and nests of atypical pleomorphic cells with high nuclear to cytoplasmic ratio and acidophilic cytoplasm with rare mitosis; foci of necrosis and hemorrhage.
Data availability statement
The data that support the findings of this study are available from the corresponding author upon reasonable request.