Figures & data
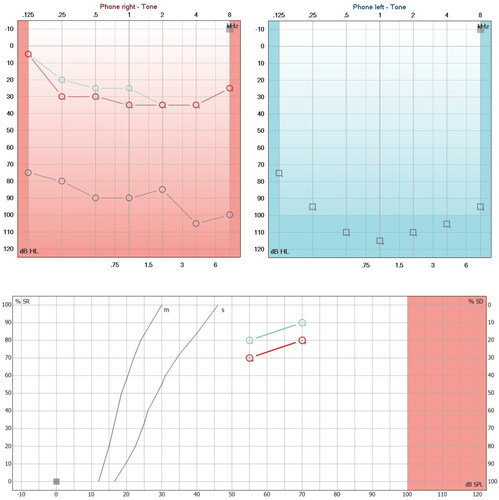
Figure 1. Hearing loss due to APS and with steroid treatment. A. First audiometry (Red and blue lines) performed at the first audiological appointment, which shows moderate right sensorineural hearing loss and left anacusis. The verbal audiometry of the right side shows a maximum phonemic discrimination of 100% at 80 dB and left anacusis. B. Second audiometry (aquamarine lines) performed 20 days after starting steroid treatment, in which profound hearing loss of the right sensorineural type and left anacusis are evident in the audiogram. The phonemic discrimination on the right side dropped dramatically until it discriminated 20% at 110 dB.
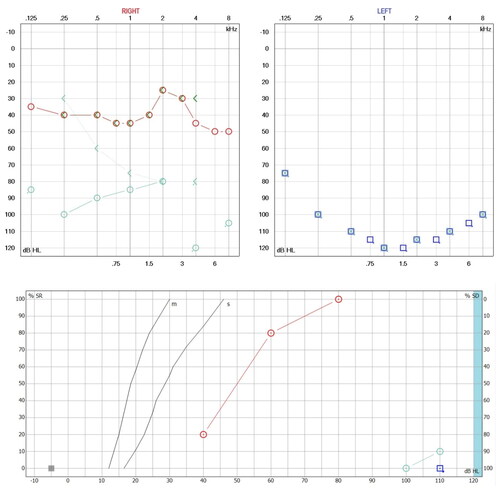
Figure 2. Tomography (TC) and magnetic resonance imaging (MRI) without alterations. (A) CT Axial reconstruction of the cochlea on the right side and lateral semicircular canal, with adequate diameter of the internal auditory canal (normal ear). (B) CT Axial reconstruction of the left side cochlea and lateral and superior semicircular canals (normal ear). (C) CT Axial reconstruction of the left side cochlea and lateral and superior semicircular canals (normal ear). (D) MRI reconstruction of the cochlea and semicircular canals in right ear. (E) MRI reconstruction of the cochlea and semicircular canals in left ear.
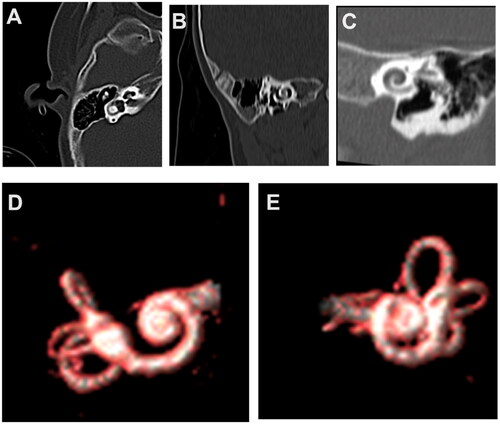
Figure 3. Cochlear implant electrode placement surgery. Surgical image of the right ear, posterior tympanotomy, stapedial tendon and pyramidal process with adequate visualization of the round window. (A) Previous insertion of the cochlear implant electrode. (B) Initiating cochlear implant electrode insertion. (C) Complete cochlear implant electrode insertion.
Figure 4. Adequate auditory responses after implant programming. (A) Impedance telemetry with adequate electrical responses in the 12 pairs of electrodes in the last programming session. (B) Postoperative automatic response telemetry of the auditory nerve (AutoART) which shows adequate responses of electrically evoked compound action potentials (eCAP) of the auditory nerve. The patient was found without any discomfort during the programming. (C) Levels (MCL-most comfortable loudness) in their last programming, which are balanced, sufficient and did not cause any discomfort for the patient. With these MCL levels, an audiogram is made which is within normal hearing parameters.
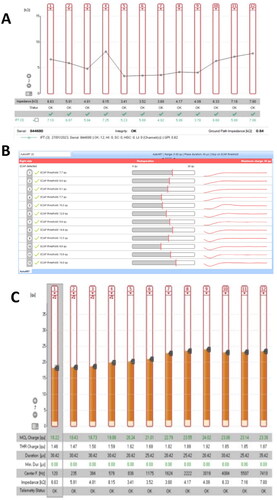
Figure 5. Hearing improvement by cochlear implant. (A) Audiometric study (Red Lines) performed 45 days after switching on the cochlear implant processor. Note the improvement in hearing thresholds in the sound field and the improvement in phonemic discrimination in speech audiometry (logoaudiometry). (B) Audiometric study (Aquamarine lines) carried out 30 days after the second programming of the cochlear implant processor, showing an average of 24 dB in pure audible tones (PTA), and phonemic discrimination on free field audiometry is 90% at 70 dB in the right ear.