Figures & data
Table 1. List of alternative keywords used in the keyword-based literature research.
Figure 1. Original ultrasound image (left), the shadow confidence map (Middle) computed by the shadow Peak algorithm, and its multiplication, the masked image (right). Note, that while soft tissue interfaces are damped, the bone surface remains barely discernable.
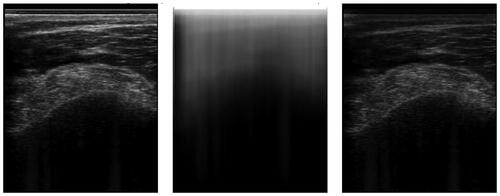
Figure 2. An example of an ultrasound image and its respective phase symmetry (PS) image. Note, that the bone surface on the left has a rather asymmetric appearance due to the hyperechoic soft tissue on top. This is why the bone surface is barely recognized.
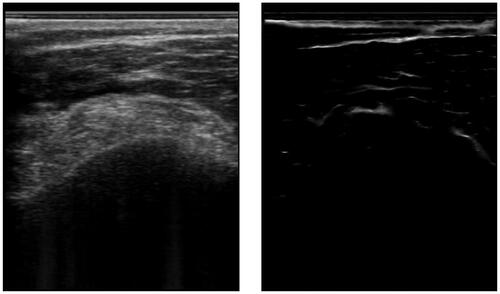
Figure 3. An example of an ultrasound image and its respective segmentation by a DeepLabv3 CNN architecture.
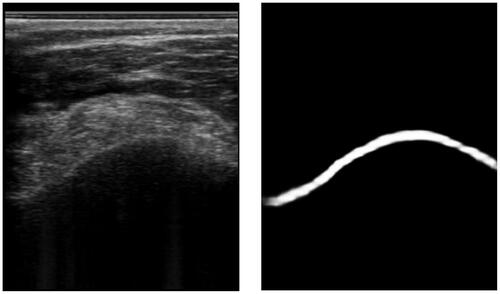
Table 2. Overview of the publications addressing segmentation.
Table 3. Summary of publications on 3D bone model completion. Algorithms categorized according to the methods section.
Figure 4. Addressed medical application (left) and targeted body parts (right) of publications on segmentation. Publications can have multiple mentions.
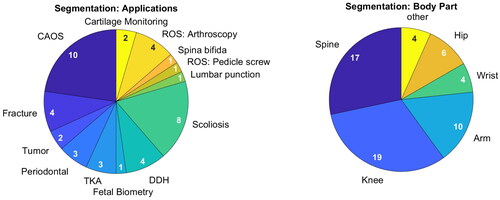
Figure 5. Addressed medical application of publications on bone model completion.
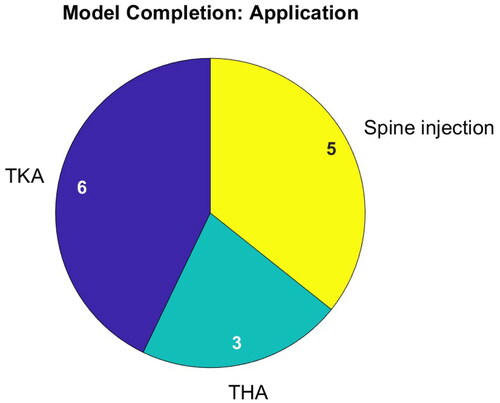
Figure 6. Testing domain for publications on segmentation (left) and bone model completion (right).
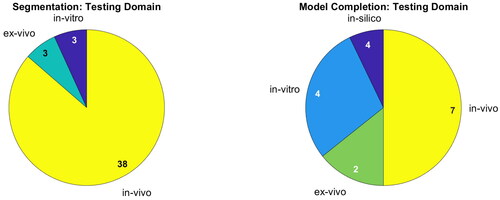
Figure 7. Methods applied for segmentation (left) and bone model completion (right). Publications can have multiple mentions.
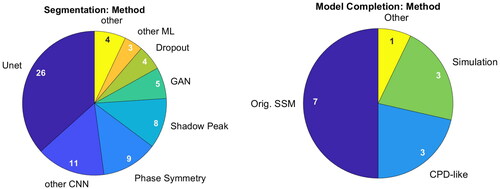
Figure 8. Quantitative performance analysis regarding segmentation. Note that the Dice metric differs strongly depending on the size of the object: Segmenting the bone shadow (marked by asterisk) significantly improves the Dice compared to segmenting just the bone response.
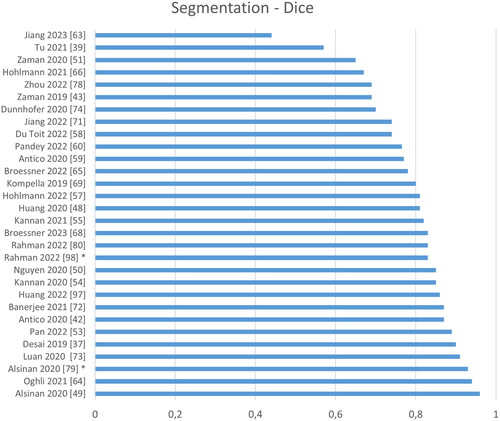
Figure 9. Quantitative performance analysis regarding segmentation. Note that the metric differs strongly depending on its definition: the surface distance error can be either directed or symmetric, computed on point clouds or surface meshes and either the absolute or the root-mean-square distance.
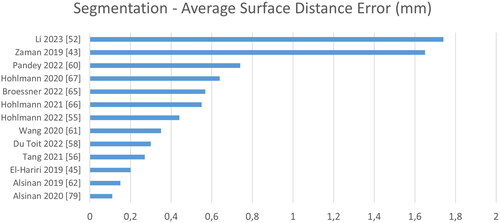
Figure 10. Analysis of computation time normalized to time per 1.000.000 pixel. Note that some images sized are based on estimates (marked by *), and that these times were reported for varying hard- and software.
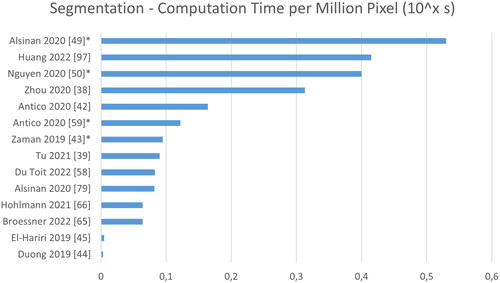
Figure 11. Quantitative evaluation of bone model completion algorithms regarding the average surface distance error in mm.
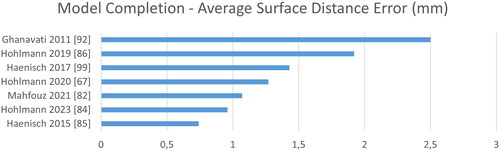
Figure 12. The target registration error describes the deviation of the computed to the ground truth transformation.
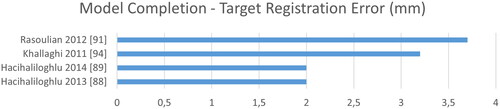
Figure 13. Similarly to TRE, the coordinate system error describes the deviation of the computed coordinate system to the ground truth coordinate system in degree.
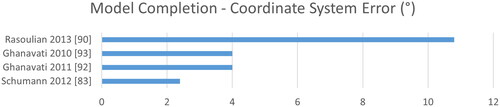
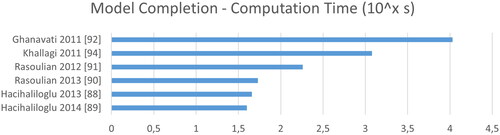
Figure 14. Computation time of bone model completion algorithms in seconds reported as the common logarithm.