Figures & data
Figure 1. Technical setup. Segmentations of the aneurysm and surrounding neurovascular structure were loaded into the Brainlab curve navigation system. HUD is a module in the navigation system. After connecting the Brainlab curve navigation system to the Zeiss Kinevo 900 (Carl Zeiss Meditec Inc, Dublin, California) correctly, HUD could be activated intraoperatively and contours of the aneurysm could be visualized under the microscope.
Yellow arrow: Brainlab Curve navigation system; green arrow: Zeiss Kinevo 900.
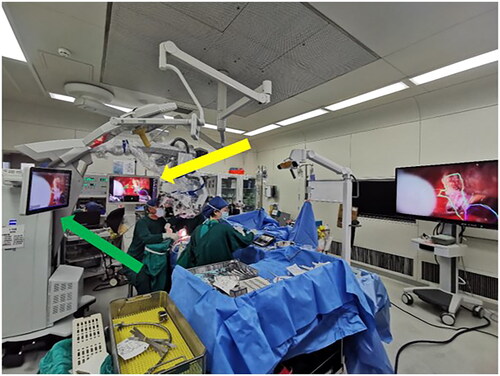
Figure 2. Study design. After randomization, residents were divided into the AR group and the control group. Image viewing period was limited to 20 min. During this period, the control group was allowed to view all 2D images of the aneurysm case, whereas the AR group was equipped with the Magic Leap One and could interact with 3D virtual objects besides viewing 2D images. After the aneurysm localization task started, participants were asked to watch the same surgical videos of non-AR-assisted cases. For AR-assisted cases, the AR group could visualize HUD in the AR-assisted surgery videos, while the control group could not, because the frames with the HUD were deleted in the videos they viewed. Then participants in both groups completed the same aneurysm localization task.
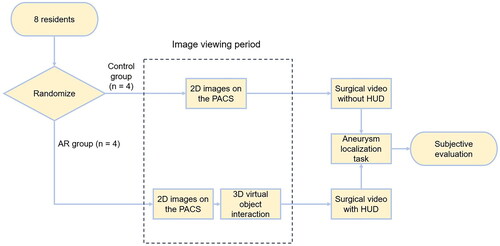
Figure 3. (A) One Of the participants using Magic Leap One to visualize the computer-generated objects overlayed on real structures. Magic Leap One is consisted of 3 elements: a light pack, a headset, and a controller. The participant uses the controller to manipulate the objects to complete their mental picture of the target aneurysm and the operative field. (B, C) a holographic display of a patient’s head, the aneurysm, and surrounding vasculature are shown to simulate the position in the operating room.
White arrow: aneurysm; yellow arrow: M2 branch; blue arrow: M1; green arrow: laser projecting from the controller.
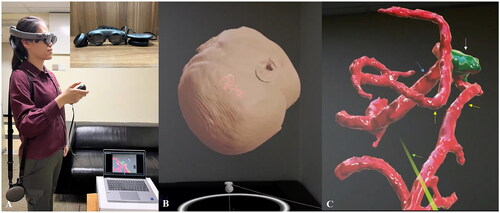
Figure 4. (A) Magnetic resonance angiography (MRA) of an aneurysm case. (B) The size of the aneurysm was measured with the Brainlab workstation at the same angle and position as it was in the surgery video. (C) Both the aneurysm and the M2 branch of the MCA were fully exposed, and the spatial relation between them was shown. (D) The size and location of the aneurysm was confirmed by the attending surgeon with a yellow circle on the screenshot right before the aneurysm was exposed. (E) The AR group could see the HUD while watching the surgical videos, whereas the control group could not (F). Likewise, participants in the AR group (G) and control group (H) were asked to draw a blue circle on the same screenshots. The actual location of the aneurysm was revealed to the participants after every case. Aneurysm localization deviation was determined by the distance “X” between the centers of the blue and yellow circle by comparing it to the size of the aneurysm.
White arrow: aneurysm; yellow arrow: M2 branch; yellow dashed line: size of the aneurysm; yellow circle: localization of the aneurysm by the attending surgeon; purple circle: HUD of the aneurysm; blue circle: localization of the aneurysm by the participants; black dashed line: aneurysm localization deviation.
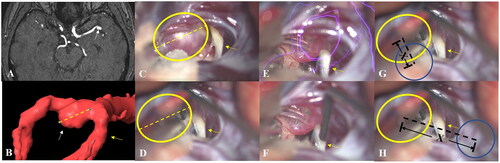
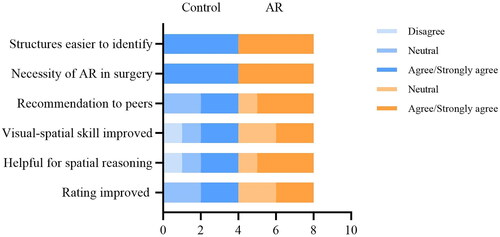
Figure 5. An electronic survey sent to participants after the aneurysm localization tests were completed.
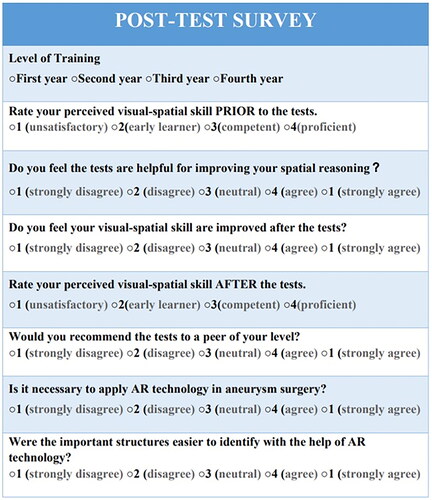
Figure 6. Aneurysm localization deviation of the control group and AR group. Blue dots represent localization deviation of the control group, while orange dots represent localization deviation of the AR group. * p ≤ 0.05, ** p ≤ 0.01, *** p ≤ 0.001.
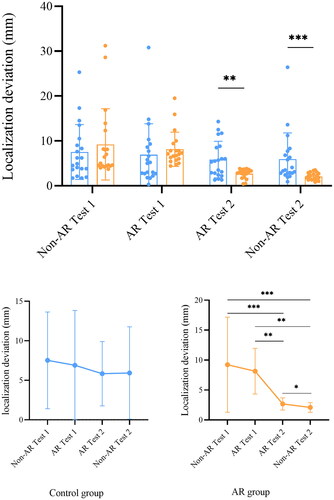
Table 1. Summary of deviation of the aneurysm localization task.
Figure 7. Comparison of aneurysm localization deviation between residents. Blue dots represent localization deviation of residents in the control group, while orange dots represent localization deviation of residents in the AR group. * p ≤ 0.05, ** p ≤ 0.01.
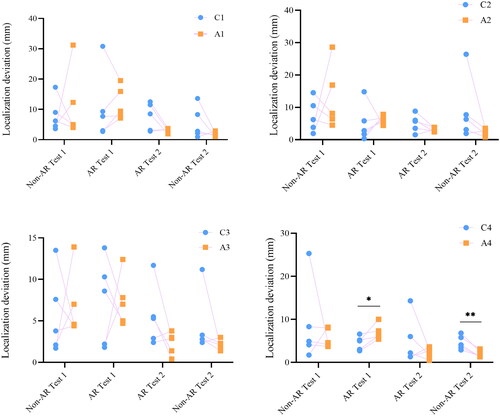
Figure 8. Test time of the aneurysm localization tasks of the AR group and control group. Blue dots represent test time of the control group, while orange dots represent test time of the AR group. * p ≤ 0.05, ** p ≤ 0.01, *** p ≤ 0.001.
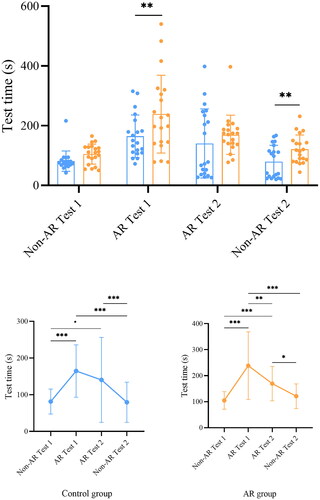
Table 2. Summary of test time of the aneurysm localization task.
Figure 9. Results of the electronic survey. The blue bar represents the choices of the control group, while the orange bar represents the choices of the AR group.