Figures & data
Table 1. Linear Regression Analysis Results.
Table 1. Sociodemographic data of the study groups.
Table 2. Evaluation of Recurrences of Depression and Cognitive Scales.
Table 3. Evaluation of Severity of Depression and Cognitive Scales
Table 4. Analysis of Intercorrelations of Scales in the Patient Group
Table 1. Patient group using risperidone.
Table 2. Patient group using olanzapine.
Table 3. Patient group using aripiprazole.
Table 1. BPRS, CDSS, SANS Scores Mean, Standard Deviations, F and p values by group and time
Table 1. Decision tree machine learning algorithms’ classification performance
Table 1. Characteristics of participants.
Table 2. Means and standart deviations of the Child Sleep Habits Questionnaire (CSHQ) Abbreviated Form total and sub-scores of ADHD and the control group.
Table 3. Means and standard deviations of the Pittsburgh Sleep Quality Index (PSQI) total and sub-scores of ADHD and the control group.
Figure 1. Anterior Cingulate Cortex (right) and medial frontal cortex (right) are the identified areas showing greater activation in children with ADHD relative to control counterparts.
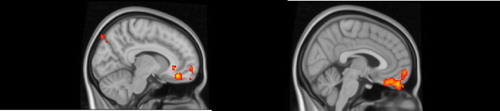
Table 1. Socio-demographic and behavioral results of the diagnostic groups.
Table 2. The ASL comparison of the diagnostic groups during entire scan.
Table 3. The ASL contrast of the diagnostic groups during go pairs.
Table 4. The ASL contrast of the diagnostic groups during no-go pairs.
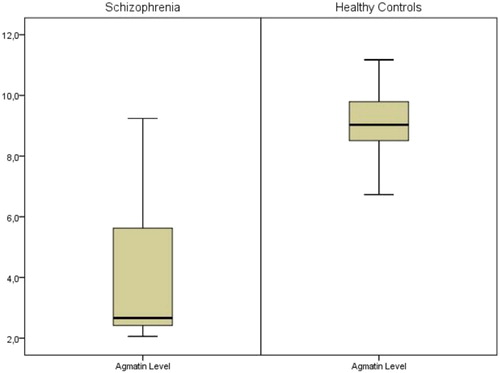
Figure 1. Blood agmatine levels in diagnostic groups (mean agmatine level was 4.04 ± 2.34 ng/ml in schizophrenia subjects and 9.11 ± 1.18 ng/ml in healthy controls, p = 0.008).