
Figures & data
Figure 1. Comparison of human body proportions using OpenPose HPE library for body, face, hands, and foot estimation. (a) Capitoline Venus (2nd century C.E.). (b) The Birth of Venus by Botticelli (c. 1484–1486) and (c) Venus Pierre Paul Prud'hon (1810).
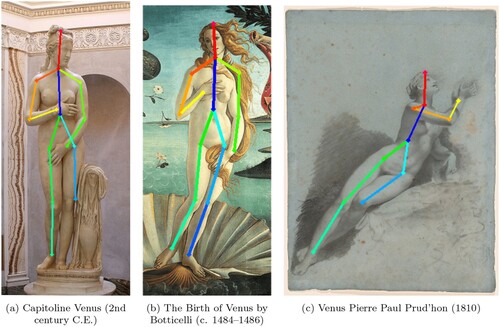
Figure 2. Bibliometric graph of automatic artwork classification.
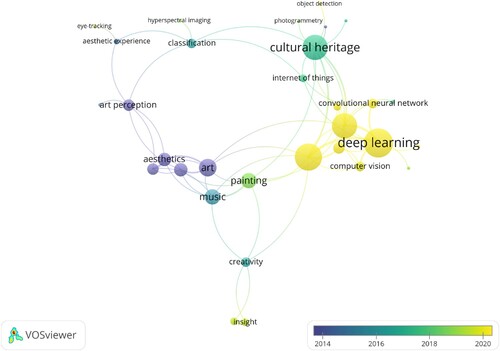
Figure 3. Bibliometric graph of human pose estimation.
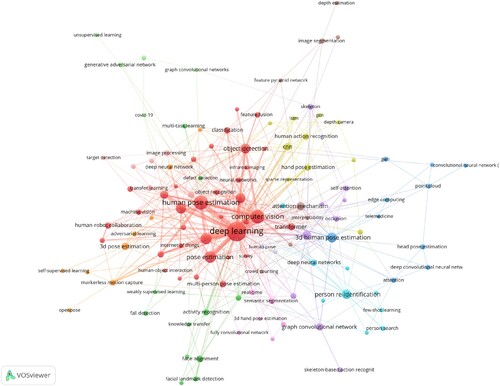
Figure 4. Top-down approach. Image origin: Pieter de Hooch – The Dutch Courtyard (1658), Mauritshuis Museum in Hague.
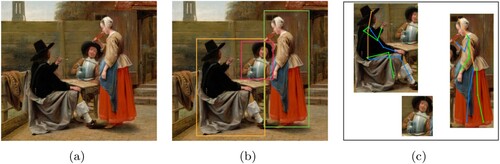
Figure 5. Bottom-up approach. Image origin: Pieter de Hooch – The Dutch Courtyard (1658), Mauritshuis Museum in Hague.
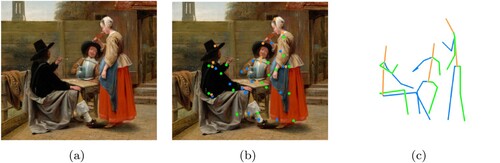
Figure 6. HPE top-down Resnet result for the MPII dataset and selected detectors. Image origin: Pieter de Hooch – The Dutch Courtyard (1658), Mauritshuis Museum in Hague. (a) Retina. (b) Yolo and (c) Faster-RCNN.
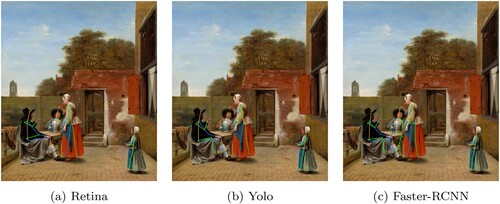
Figure 7. HPE result for selected datasets. Source image: Thomas Gainsborough – The Blue Boy (Jonathan Buttall) (1770), Huntington Library, San Marino, California. (a) MPII dataset. (b) COCO dataset and (c) BODY_25 dataset.
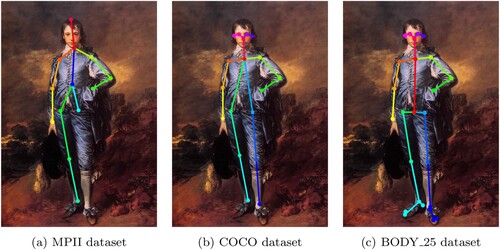
Table 1. Body part mapping for selected datasets.
Figure 8. Finding outliers allows us to detect these HPE architectures, which cannot correctly detect human proportions in historical paintings.
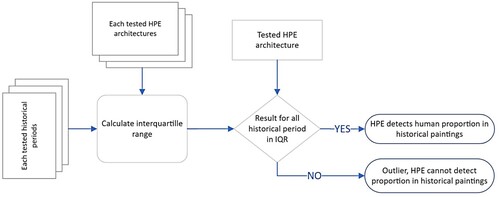
Figure 9. The Kruskal-Wallis test makes it possible to check whether the population of the values of the calculated human proportions in epochs differs significantly.
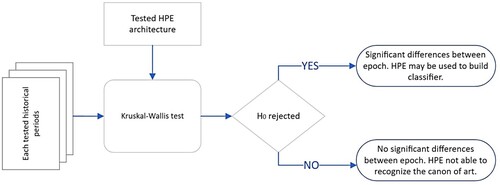
Table 2. Size of the collected painting dataset and characters detected inside the paintings by epochs.
Table 3. Calculated interquartile range and the bounds of valid proportion values.
Figure 10. Invalid output of (a) Faster-RCNN Topdown Heatmap + Shufflenetv1 on 0.3, (b) Retina Deeppose + Resnet on 0.3, (c) Yolo Topdown Heatmap + Shufflenetv1 on 0.7. Image origin: Pieter de Hooch – The Dutch Courtyard (1658), Mauritshuis Museum in Hague.
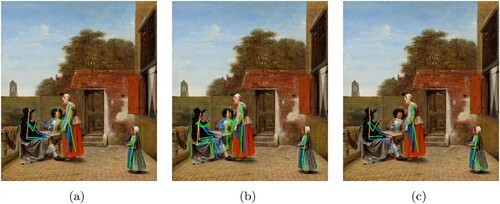
Table 4. Experiments that produce outliers.
Table 5. Kruscal-Willis test for statistical signifcance selected human body proportion ,
,
during historical epoch.
Table 6. Kruscal-Willis test for statistical signifcance selected human body proportion ,
,
during historical epoch.
Table 7. Kruscal-Willis test for statistical signifcance selected human body proportion ,
,
during historical epoch.
Table 8. Nemenyi pairwise post hoc test for Topdown Heatmap + Scnet model with the threshold parameter of 0.3.