
Figures & data
Figure 1. Cumulative number of HRA methods according to the year of publication (Hollnagel, Citation2005).
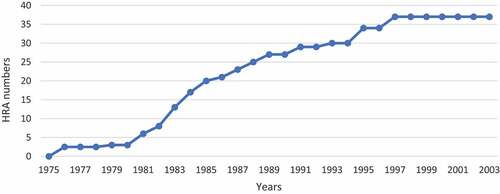
Figure 2. Domino model of accident (Qureshi, Citation2007).
Figure 3. Swiss cheese model for accident causation (Reason, Citation2000).
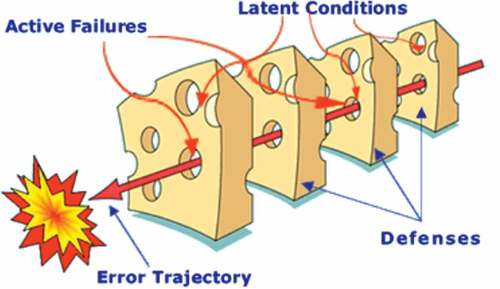
Figure 4. Illustration of systemic accident model (Department of Energy, Citation2012).
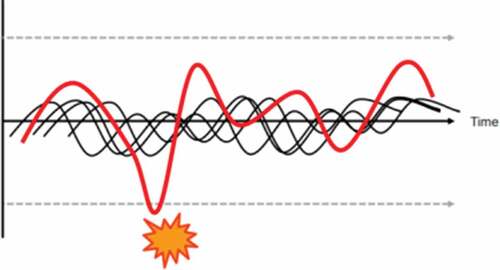
Table 1. Human reliability assessment methods for sequential, epidemiological, and systematic techniques (Underwood & Waterson, Citation2013a).
Figure 5. Developed methodology for the estimation of HEP value for marine and offshore maintenance operations.
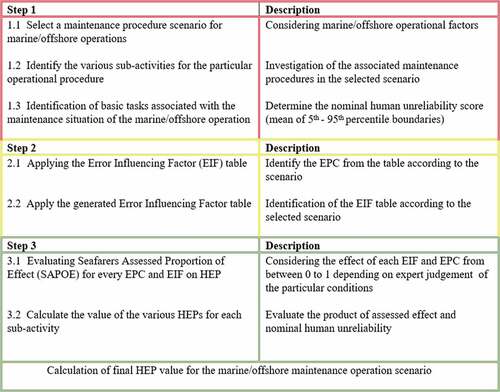
Table 2. HEART generic task (Williams, Citation1988).
Table 3. Attributes attached to each weight from the questionnaire.
Table 4. Modified error producing conditions in HEART methodology.
Table 5. Error influencing factor for seafarers.
Figure 6. Process for development of EIF table.
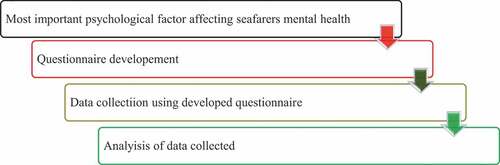
Table 6. Mean and standard deviation values of the importance of the influencing factors generated from the questionnaire.
Table 7. Proportional effect of the influencing factors generated from the survey (SAPOE for covid-19).
Figure 7. Demography of response.
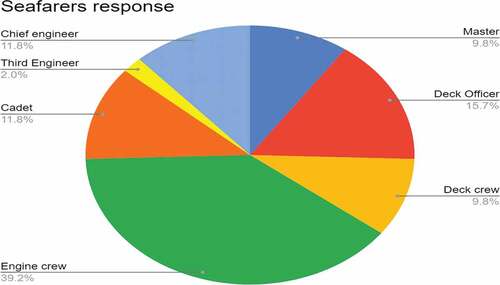
Figure 8. Response to weight of each influencing factor.
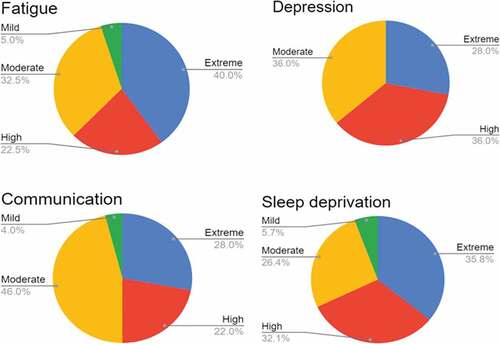
Figure 9. Mooring winch (Aicrane, Citation2022).
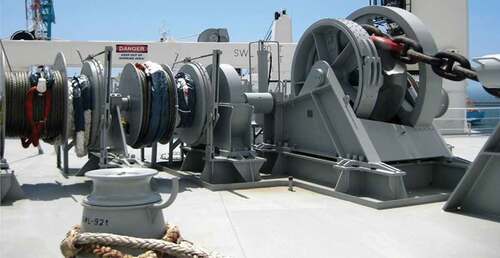
Table 8. Calculation of mooring maintenance operation scenario before covid-19.
Table 9. Calculation of mooring maintenance operation scenario during covid-19.
Table 10. Frequency of mooring accidents.
Figure 10. HEP for mooring equipment maintenance before covid-19.
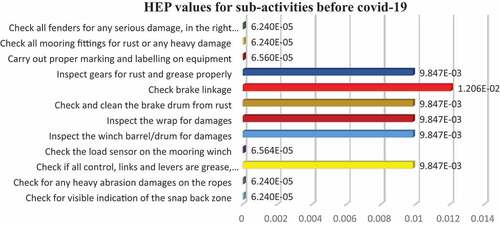
Figure 11. HEP for mooring equipment maintenance during covid-19.
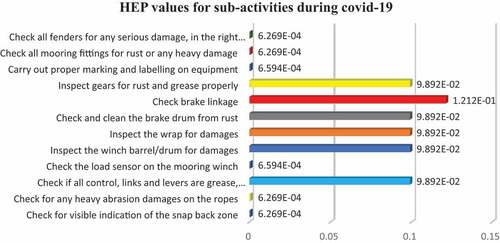
Figure 12. Event tree showing mooring operation failure before covid-19.
Figure 13. Event tree showing mooring operation failure during covid-19.
Table 11. PLL calculation for fatalities.