
Figures & data
Figure 1. The principle of LIFT.
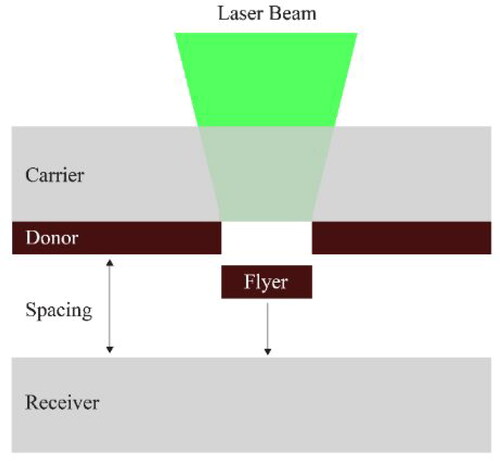
Figure 2. UV–Visible absorption spectra of the CuONPs suspension EG/W (a), 1,3PrG/W (b), and in 1,2PrG/W (c).
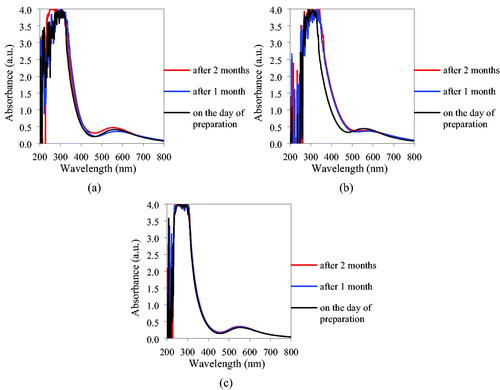
Figure 3. TEM images of the CuONPs in EG/W (a), 1,3PrG/W (b), and 1,2PrG/W (c).
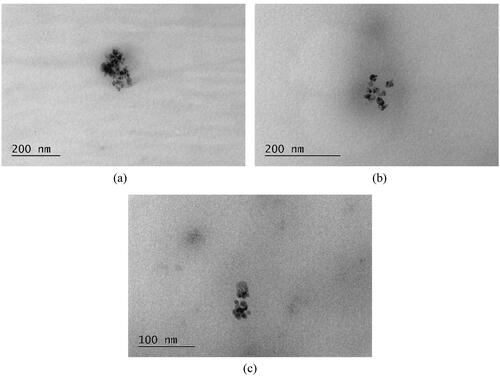
Figure 4. The viscosity of the samples as a function of shear rate.
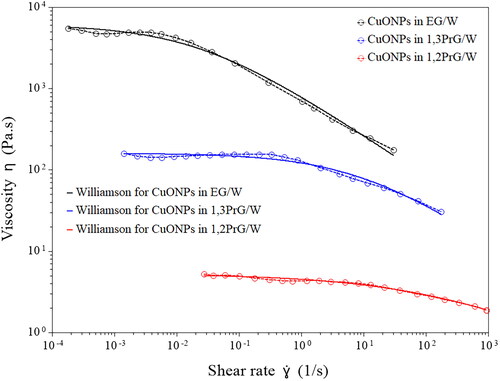
Table 1. Parameters of the Williamson model for the three samples.
Figure 5. Weight % as a function of temperature as obtained from the TGA tests on the samples.
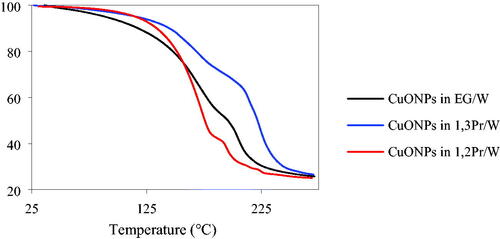
Figure 6. Heat flow as a function of temperature as obtained from the DSC tests on the samples (a) and the pure media (b), respectively.
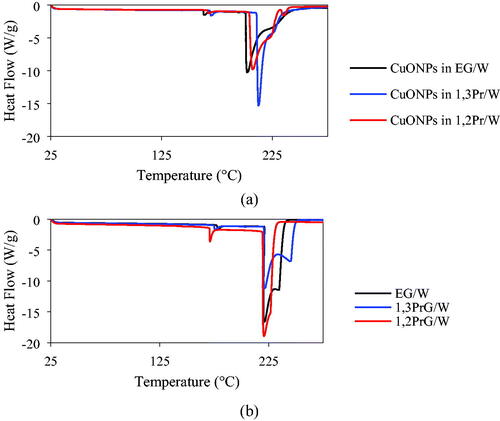
Table 2. Peak data obtained from the DSC results for the samples and the pure media.