
Figures & data
Figure 1. Identification of Hallmark gene sets-associated AS events. (A, B) The activities of tumor signaling pathways in normal, early-stage and advance-stage of LUSC were calculated by the PEGASAS analysis. Hallmark_Myc_Targets_V1 (A) and Hallmakr_Apical_Surface (B) were shown. (C, D) GO BP analysis of Hallmark_Myc_Targets_V1 (C) and Hallmakr_Apical_Surface (D)-associated AS events. (E) KEGG pathway enrichment of Hallmakr_Apical_Surface (left) and Hallmark_Myc_Targets_V1 (right)-associated AS events.
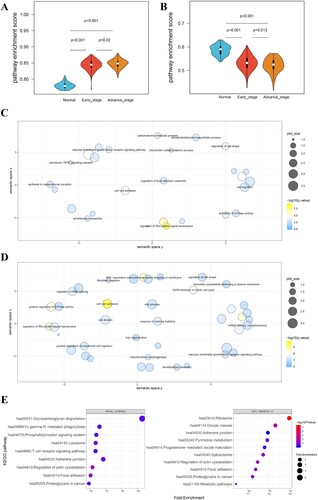
Figure 2. Screening of prognosis-related AS events and AS-based LUSC subtype classification. (A) Heatmap of PSI value of differential AS events between normal, early-stage and advance-stage LUSC. (B) Unsupervised heatmap of PSI value of prognostic AS events. (C) The Kaplan-Meier survival curve of LUSC clusters. (D–G) distribution of patient tumor stage (D), age (E), gender (F) and pathologic_N (G) in LUSC clusters.
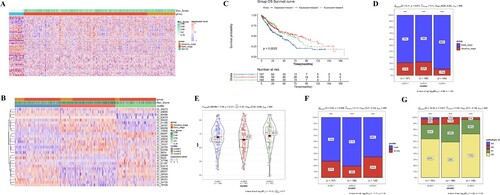
Table 1. Univariate Cox regression analysis of prognosis-related AS events.
Figure 3. Construction and evaluation of the predictive efficacy of the prognostic model. (A) λ selection in LASSO model. (B–K) The Kaplan-Meier survival curve of OS-related AS events.
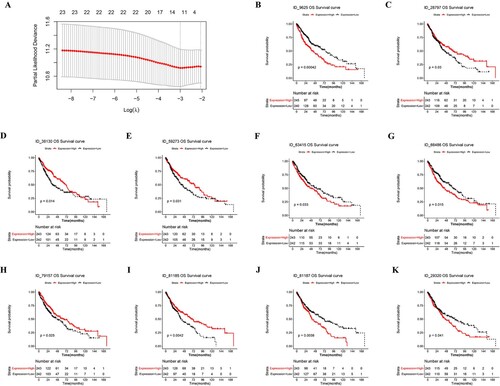
Table 2. Optimized prognostic AS events.
Figure 4. Evaluation of the predictive efficacy of the prognostic model. (A–C) PS scores distribution (Up), patient survival information (Middle), and heatmap for PSI of 10 prognostic AS events (Low) in the training set (A), validation set (B), and whole set (C). (D–F) The Kaplan-Meier survival curve of high- and low-risk groups in the training set (D), validation set (E), and whole set (F). (G) distribution of LUSC clusters in high- and low-risk groups.
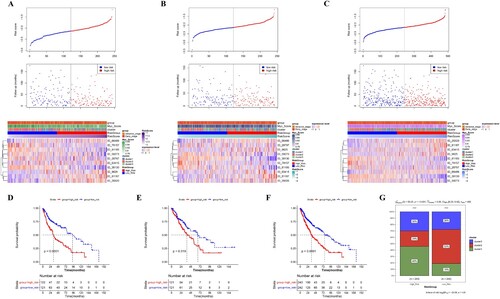
Figure 5. Regulatory network of AS and splicing factors. The diamond nodes represent splicing factors (SF); the ellipse nodes represent favorable alternative splicing (AS) events, and the circle nodes represent unfavorable AS events; the lines represent the correlation between AS events and SFs, respectively.
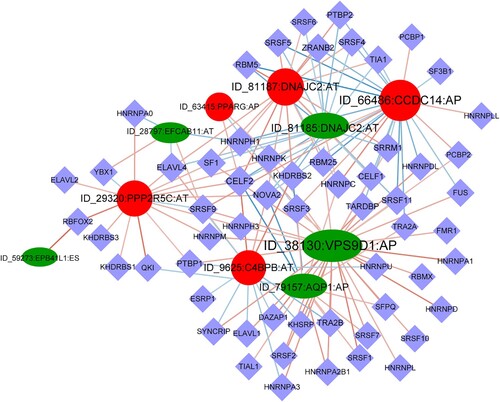
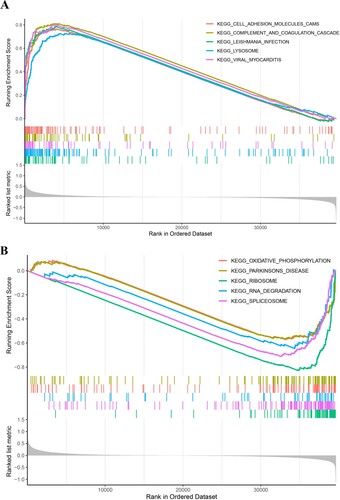
Figure 6. GSEA pathway enrichment analysis. The top 5 differential KEGG pathways enriched in the high-risk group (A) and low-risk group (B).
Supplemental Material
Download Zip (1,019.8 KB)Data availability statement
The (log2(fpkm+1) RNAseq data and phenotype data of Lung Squamous Cell Carcinoma (LUSC) used in this study is available publicly from The Cancer Genome Atlas (TCGA) database at https://xenabrowser.net/. The percent spliced index (PSI) values of alternative splicing events of TCGA-LUSC samples were available from the SpliceSeq database http://projects.insilico.us.com/TCGASpliceSeq/. GSE19188 and GSE30219 datasets were available from the Gene Expression Omnibus database at https://www.ncbi.nlm.nih.gov/geo/query/acc.cgi?acc.