
Figures & data
Figure 1. TXYF treatment could alleviate the symptoms of DNBS-induced ulcerative colitis (UC) in rats. (A) Experimental design of DNBS-induced UC and TXYF treatment. (B) Changes in body weights of rats. (C) Disease activity index (DAI) score. (D) Colon mucosal damage index (CMDI) score. (E) Tumor necrosis factor-α (TNF-α) level. (F) Microscopic view of the colon of the UC rats. (G) Hematoxylin-eosin (HE) staining of colon from each group. Black arrow represents mucosal architecture and white arrow represents goblet cells. All data are analyzed using ANOVA test and presented as the mean ± standard deviation (n = 8). **p-value < 0.01 compared with Control group, and ##p-value < 0.01, compared with the DNBS-colitis group .
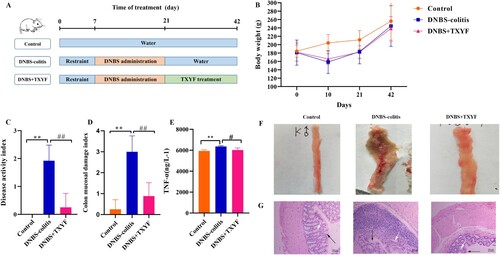
Table 1. The DAI scores of rats in each group.
Table 2. CMDI scores of rats in each group.
Figure 2. Relative abundance of microbial community in each group. (A) Microbiota composition at the phylum level. (B) Microbiota composition at the genus level. The x-axis indicated the sample name, and the y-axis indicated the relative abundance of the annotated species.
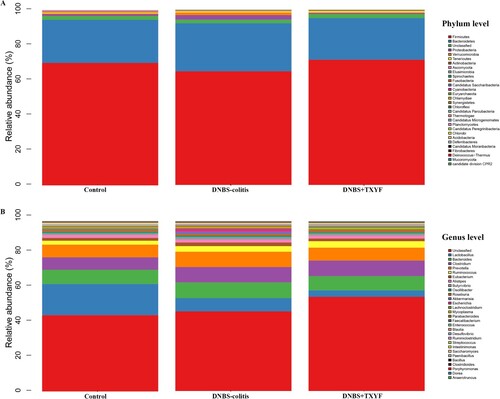
Figure 3. Identification of differential microbiota between the two groups at the genus level. (A) Venn diagram of the differential flora between different comparison groups. (B) Differential microbes in the Control group vs. DNBS-colitis group. (C) Differential microbes in the DNBS-colitis group vs. DNBS + TXYF group. (D) The relative abundance of differential microbes related to TXYF treatment. The x-axis represents the name of microbiota and the y-axis represents the relative abundance of microbiota.
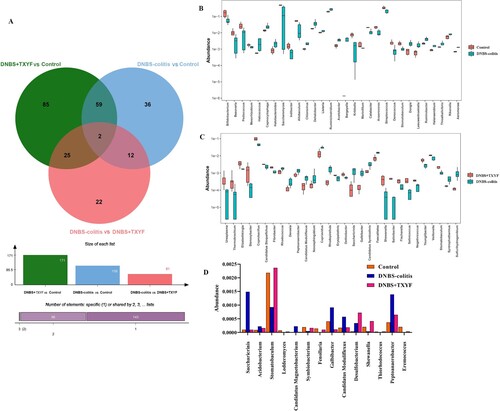
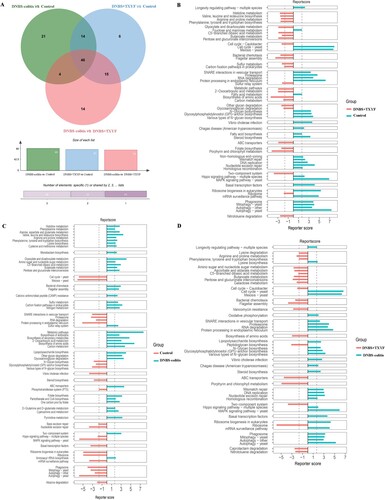
Figure 4. Differential KEGG pathways between two groups. (A) Venn diagram of the differential pathways between different comparison groups. (B) DNBS + TXYF group vs. Control group. (C) Control group vs. DNBS-colitis group. (D) DNBS-colitis group vs. DNBS + TXYF group. Bar plots represent the reporter scores of each pathway in the two groups. A reporter score ≤ −1.65 indicates pathway enriched in the former group. A score > 1.65 indicates pathway enriched in the latter group.
Supplemental Material
Download JPEG Image (401.1 KB)
Data availability statement
The metagenomics sequencing data are uploaded to NCBI BioProject (https://www.ncbi.nlm.nih.gov/bioproject/) with the accession number PRJNA801003. The data that support the findings of pathological indices are available in 4TU.ResearchData at doi:10.4121/18319907 (https://figshare.com/s/09475f78c42ddbbc2d03).