
Figures & data
Figure 1. SSS function (in green) and FMAV function (in yellow) for a location in the tropical North Atlantic (10°N, 30°W) from 2015 April to 2019 April derived from monthly data (black markers). The gray lines connecting two functions visualize a synchronization of the features of two functions in time.
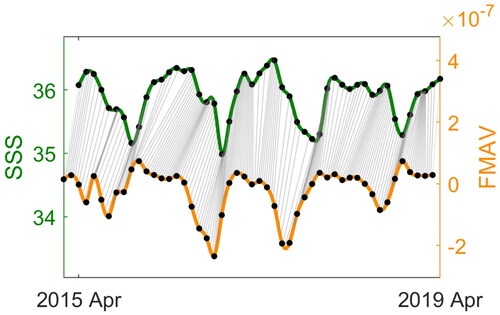
Figure 2. Visualization of 11 locations and estimated phase difference between SSS and FMAV at those locations. For each plot, the black function represents the phase estimated through the presented pairwise function registration procedure and the blue horizontal line shows the constant phase obtained via harmonic analysis for comparison. The black dashed lines serve as reference.
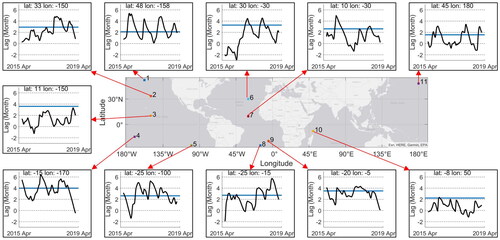
Figure 3. Summary of estimated lag functions from function registration and phases from harmonic analysis at location 1 through 6. The index of locations as indicated in is in the first column. Column (a) displays the SSS (in green) and FMAV (in yellow) functions of each location. The gray lines represent the matching of SSS and FMAV achieved by function registration. In column (b) are the lag functions derived using the function registration in black (in the same manner as ) and the time lag estimated by harmonic analysis in blue. The resulting alignment of functions are displayed in column (c) using the same colors.
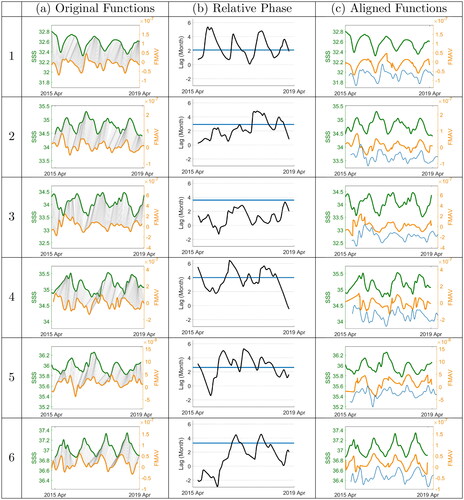
Figure 4. Continued summary of estimated lag functions from function registration and phases from harmonic analysis at location 7 through 11 in the same manner as . (a) The SSS (in green) and FMAV (in yellow) functions of each location with the gray lines representing the matching of SSS and FMAV achieved by function registration. (b) The lag functions derived using the function registration in black and the time lag estimated by harmonic analysis in blue. (c) The resulting alignment of functions.
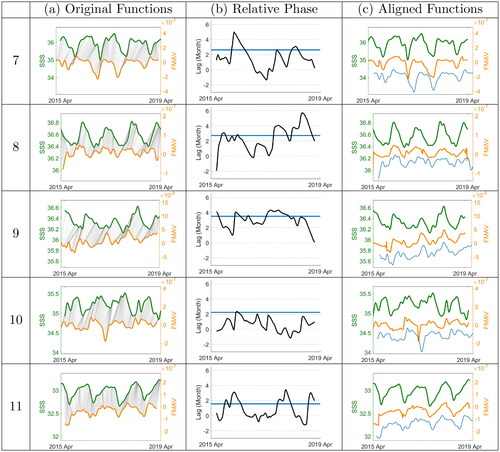
Table 1. (A) Distance between SSS function and FMAV function registered to SSS achieved by applying the estimated lag function; (B) Distance between SSS function and FMAV function shifted by the constant phase difference estimated using harmonic analysis.
Data Availability Statement
Data used in this paper come from the following sources:
Roemmich & Gilson SSS: https://sio-argo.ucsd.edu/RG/_Climatology.html.
OAFlux evaporation: https://climatedataguide.ucar.edu/climate-data/oaflux-objectively-analyzed-air-sea-fluxes-global-oceans.
MIMOC mixed layer depth: https://www.pmel.noaa.gov/mimoc/.
GPM IMERG precipitation: https://gpm.nasa.gov/data/imerg.
OSCAR surface velocity: https://podaac.jpl.nasa.gov/dataset/OSCAR/_L4/_OC/_third-deg.
NOAA Coastwatch Ekman Upwelling: https://coastwatch.pfeg.noaa.gov/erddap/griddap/erdQAstressmday.html.