Figures & data
Table 1. List of finite mixture modeling software.
Table 2. Summary of simulation scenarios.
Table 3. Simulation results in scenarios I and II from the censored multivariate GMR and five other approaches.
Figure 1. Clustering accuracy of the censored multivariate GMR, ignore-censoring multivariate GMR, and censored mulivariate GMM. Displayed are the results associated with the median ARI from 101 simulations. Blue indicates that the observation was correctly classified using the posterior probabilities of cluster membership, and red indicates incorrect classification. Jitter added to improved visualization.
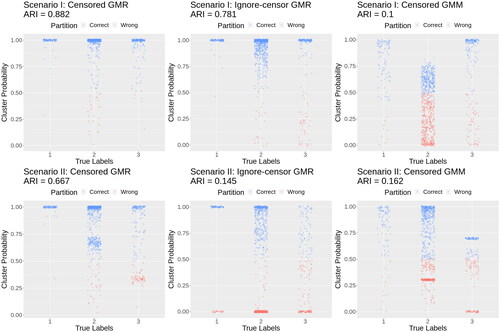
Figure 2. CSF biomarker data from the Emory ADRC/HBS Study. The diagonals represent histograms of the CSF biomarkers, the lower off-diagonals are scatterplots, and the upper off-diagonals are the Pearson correlations with *** denoting p-value <0.001.
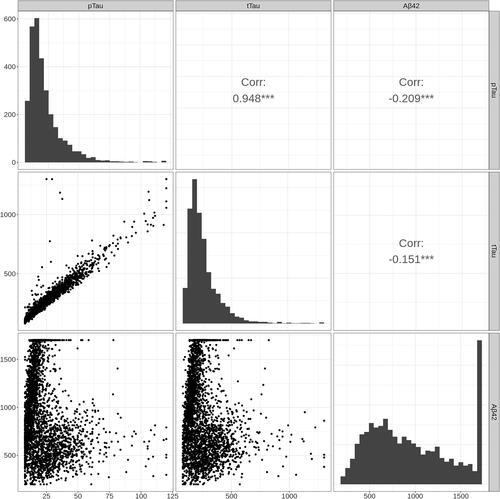
Table 4. Patient demographics of the Emory Goizueta Alzheimer’s Disease Research Center and the Emory Healthy Brain Study Dataset.
Figure 3. Scatter plots and violin plots of the diagnosis vs. the clusters identified with G = 3. The top row (A–C) has points colored by the diagnosis labels. The middle row (D–F) has points colored by the clusters estimated in the censored GMR, in which the CSF biomarkers formed a multivariate response with predictors age, education, gender, race, and APOE4. The bottom row (G–I) shows violin plots with side-by-side comparisons of the 3 CSF biomarkers between the clinical diagnostic groups and the model estimated clusters, namely: AD vs. AD-like, Normal vs. Control-like, and Other vs. Non-AD pathology. The cluster descriptions “AD-like,” “Control-like” and “Non-AD pathology” were determined by inspecting the characteristics of each cluster; see text.
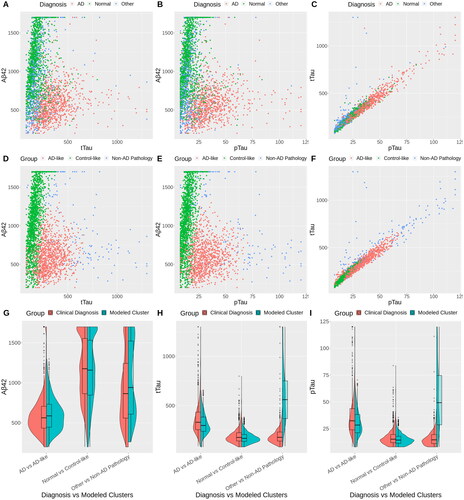
Table 5. Estimated coefficient matrices.
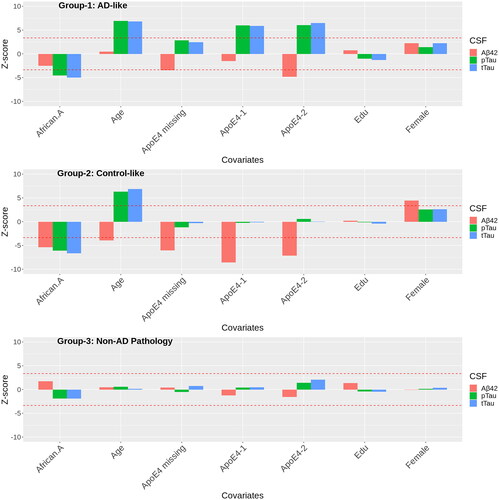
Figure 4. Bar plots of the Z-scores of the estimated within-cluster effects of the predictors in the selected G = 3 model. The low Abeta42 high tau group has the greatest overlap with AD diagnosis. The high Abeta42 low tau group has the greatest overlap with cognitively normal. The high Abeta42 and high tau group have mixed pathology, which includes some MCI and other diagnoses. The dashed horizontal lines are the critical Z-score subject to Bonferroni correction for 63 comparisons.