Figures & data
Table 1 Summary of strengths and weaknesses of each of the reviewed programs.
Table 2 Summary of graphical capabilities of each software.
Fig. 1 JASP descriptive graphical output for numerical data.
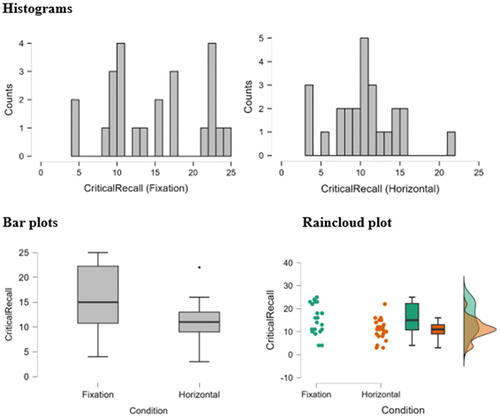
Fig. 2 Jamovi descriptive graphical output for numerical data.
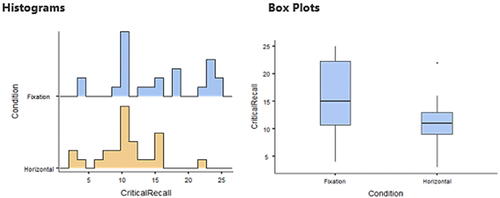
Fig. 3 BlueSky Statistics descriptive graphical output for numerical data.
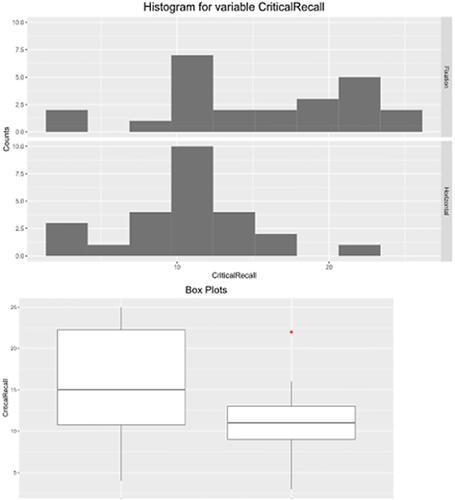
Fig. 4 Epi info descriptive graphical output for numerical data (box plot isn’t available).
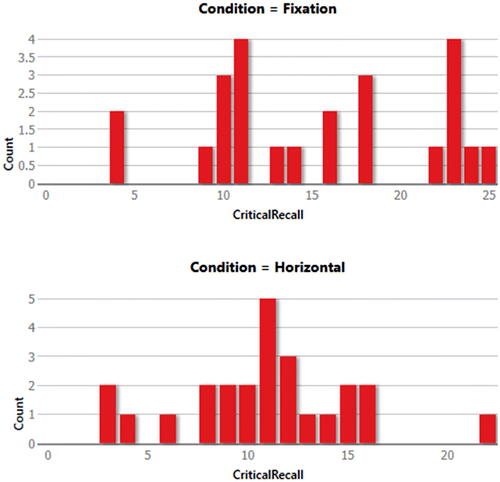
Fig. 5 Statistics kingdom descriptive graphical output for numerical data.
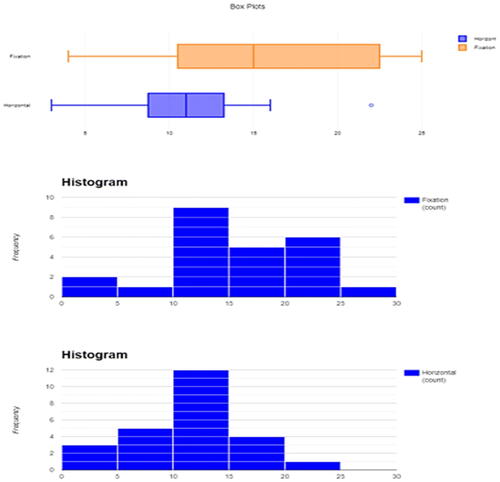
Fig. 6 PSPP descriptive graphical output for numerical data (stratification is not available).
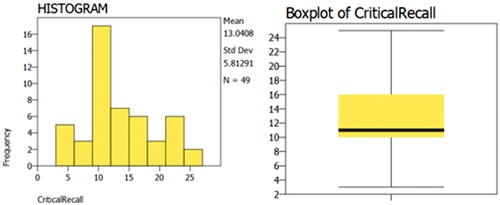
Fig. 7 SOFA Statistics descriptive graphical output for numerical data.
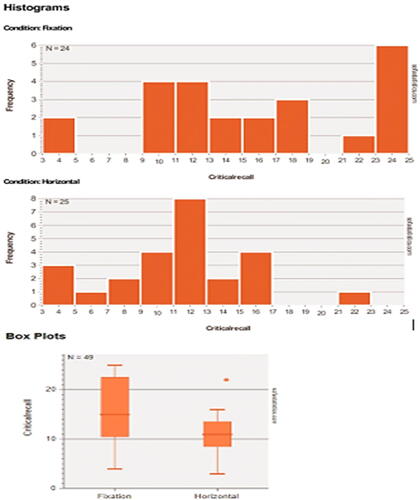
Fig. 8 Kaplan-Meier Curves with risk table for acute myeloid leukemia patients with and without maintenance therapy (Jamovi).
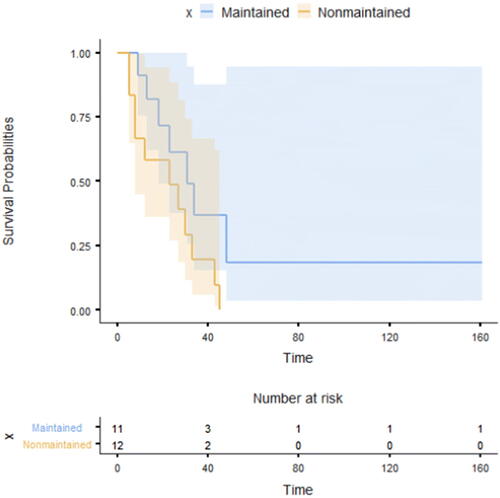
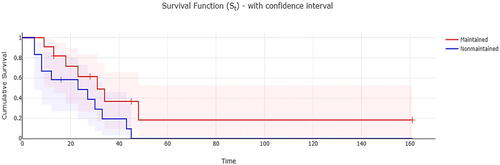
Fig. 9 Kaplan-Meier Curves with risk table for acute myeloid leukemia patients with and without maintenance therapy (JASP).
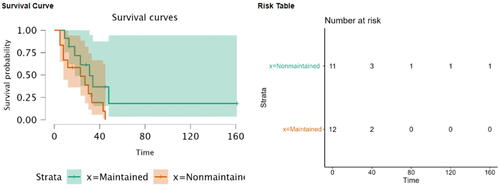
Fig. 10 Kaplan-Meier Curves with risk table for acute myeloid leukemia patients with and without maintenance therapy (BlueSky Statistics).
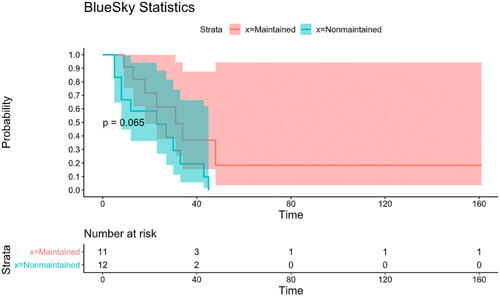
Fig. 11 Kaplan-Meier Curves (risk table isn’t available) for acute myeloid leukemia patients with and without maintenance therapy (Statistics kingdom).