900
Views
20
CrossRef citations to date
0
Altmetric
Original

Biocompatibility of Alginates for Grafting: Impact of Alginate Molecular Weight

, , , , , , , & show all
Pages 383-394 | Published online: 24 Aug 2009

Figures & data

Figure 1. A representative example for objective quantification of microbead induced fibrosis. (A) Selection of fibrotic tissue. (B) Selection of alginate capsules. The histograms in (A) fibrotic tissue and (B) alginate capsules are generated (see methods) and afterwards fibrotic reaction was calculated as fibrotic area per alginate capsule (µm2). (Go to www.dekker.com to view this figure in color.)
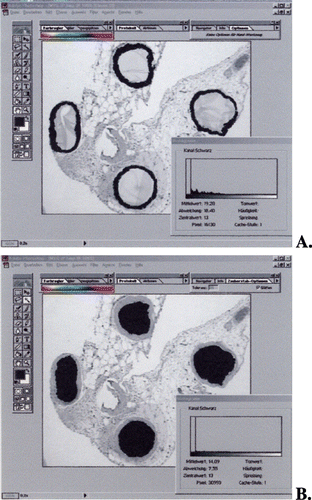
Figure 1. A representative example for objective quantification of microbead induced fibrosis. (A) Selection of fibrotic tissue. (B) Selection of alginate capsules. The histograms in (A) fibrotic tissue and (B) alginate capsules are generated (see methods) and afterwards fibrotic reaction was calculated as fibrotic area per alginate capsule (µm2). (Go to www.dekker.com to view this figure in color.)

Table 1. Molecular Weight Distribution of Different Alginate Preparations Performed by Gel Permeation Chromatography. (A) Autoclaved Alginate (LV‐Alginate). (B) Autoclaved Alginate and Afterwards Sterile‐Filtrated (LV*‐Alginate). (C) Sterile‐Filtrated Alginate Solution (MV‐Alginate)

Figure 2. Molecular weight distribution of different alginate preparations performed by gel permeation chromatography. (A) Autoclaved alginate (LV‐alginate). (B) Autoclaved alginate and afterwards sterile‐filtrated (LV*‐alginate). (C) Sterile‐filtrated alginate solution (MV‐alginate). (Go to www.dekker.com to view this figure in color.)
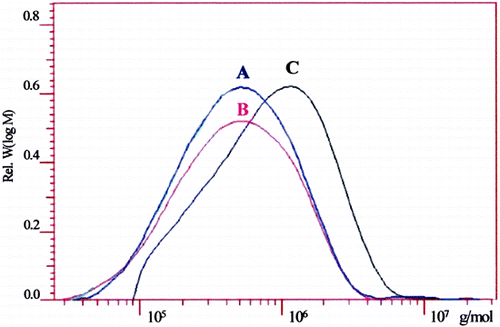
Figure 2. Molecular weight distribution of different alginate preparations performed by gel permeation chromatography. (A) Autoclaved alginate (LV‐alginate). (B) Autoclaved alginate and afterwards sterile‐filtrated (LV*‐alginate). (C) Sterile‐filtrated alginate solution (MV‐alginate). (Go to www.dekker.com to view this figure in color.)

Figure 3. Extent of tissue fibrosis induced by transplantation of alginate beads made of different alginate solutions into a muscle pouch. Fibrotic reaction was calculated as area of fibrotic tissue/capsule, corresponding to µm2/capsule (dependent on magnification and the resolution of the image). Values are means ± SEM. (Go to www.dekker.com to view this figure in color.)
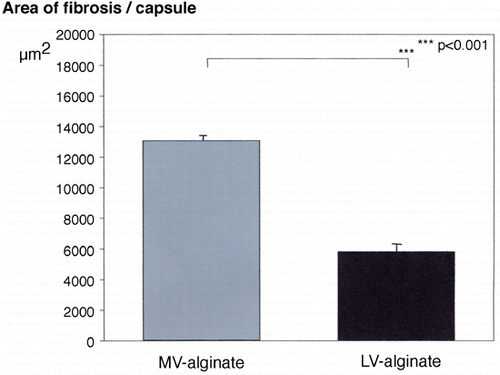
Figure 3. Extent of tissue fibrosis induced by transplantation of alginate beads made of different alginate solutions into a muscle pouch. Fibrotic reaction was calculated as area of fibrotic tissue/capsule, corresponding to µm2/capsule (dependent on magnification and the resolution of the image). Values are means ± SEM. (Go to www.dekker.com to view this figure in color.)

Figure 4. Extent of tissue fibrosis induced by different empty alginate beads or multilayer microcapsules (AD) into a muscle pouch. (A) Alginate beads made MV‐alginate without a covering outer membrane. (B) Alginate beads made of MV‐alginate with a PEI‐PAA‐PEI‐alginate (MV‐alginate) covering outer membrane. (C) Alginate beads made of LV‐alginate with a PEI‐PAA‐PEI‐alginate (MV‐alginate) covering membrane. (D) Alginate beads made of LV‐alginate with a PEI‐PAA‐PEI‐alginate (LV‐alginate) covering membrane. Fibrotic reaction was calculated as area of fibrotic tissue/capsule, corresponding to µm2/capsule (dependent on magnification and the resolution of the image). Values are means ± SEM. No statistical differences were found between the values of group A vs. B. (Go to www.dekker.com to view this figure in color.)
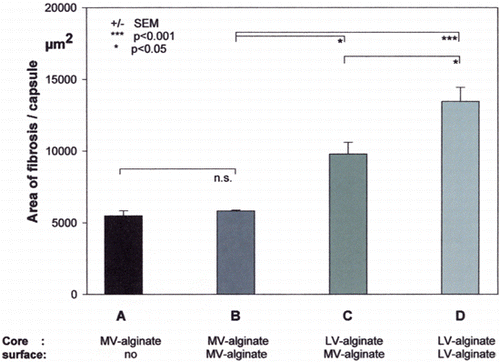
Figure 4. Extent of tissue fibrosis induced by different empty alginate beads or multilayer microcapsules (A–D) into a muscle pouch. (A) Alginate beads made MV‐alginate without a covering outer membrane. (B) Alginate beads made of MV‐alginate with a PEI‐PAA‐PEI‐alginate (MV‐alginate) covering outer membrane. (C) Alginate beads made of LV‐alginate with a PEI‐PAA‐PEI‐alginate (MV‐alginate) covering membrane. (D) Alginate beads made of LV‐alginate with a PEI‐PAA‐PEI‐alginate (LV‐alginate) covering membrane. Fibrotic reaction was calculated as area of fibrotic tissue/capsule, corresponding to µm2/capsule (dependent on magnification and the resolution of the image). Values are means ± SEM. No statistical differences were found between the values of group A vs. B. (Go to www.dekker.com to view this figure in color.)

Reprints and Corporate Permissions

Please note: Selecting permissions does not provide access to the full text of the article, please see our help page How do I view content?

To request a reprint or corporate permissions for this article, please click on the relevant link below:

Academic Permissions

Please note: Selecting permissions does not provide access to the full text of the article, please see our help page How do I view content?

Obtain permissions instantly via Rightslink by clicking on the button below:

If you are unable to obtain permissions via Rightslink, please complete and submit this Permissions form. For more information, please visit our Permissions help page.