Figures & data
Figure 1. The mean (± SE) plasma urea nitrogen level at specified time of in vitro experiments: No significant change in plasma urea after incubation with Lactobacillus without preceding induction.
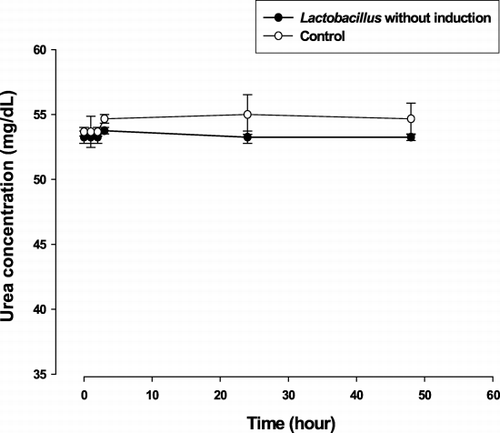
Figure 2. The mean (± SE) plasma urea nitrogen level at specified time of in vitro experiments: Removal of plasma urea by Lactobacillus after induction as shown by significantly lower concentration as compared to baseline after 24 and 48 hours of incubation.
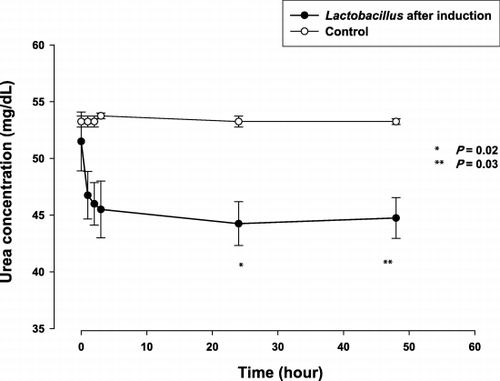
Figure 3. The mean (± SE) plasma urea nitrogen level at specified time of in vitro experiments: Significantly lower plasma urea with Lactobacillus after induction, compared using the independent samples t test.
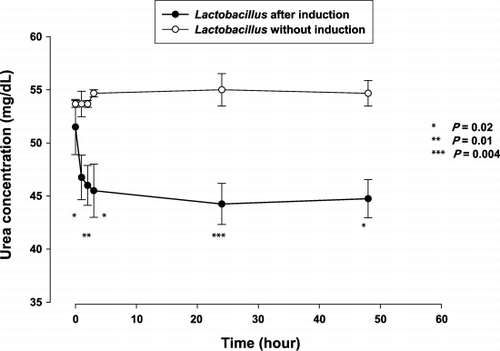
Figure 4. Photomicrograph of freshly prepared alginate‐poly‐L‐lysine alginate artificial cell microcapsules (250 µm diameter) containing Lactobacillus delbrueckii.
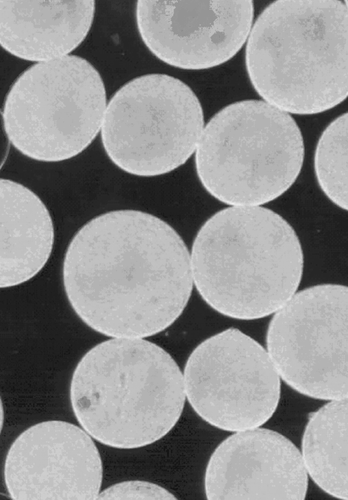
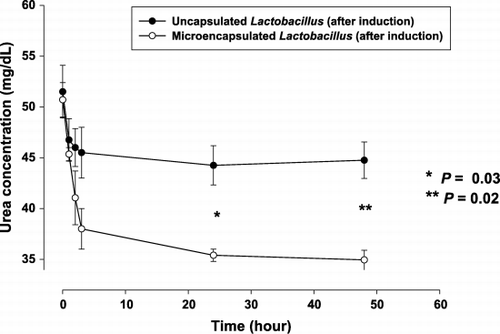
Figure 5. The mean (± SE) plasma urea nitrogen level at specified time of in vitro experiments: Significantly lower plasma urea with microencapsulated Lactobacillus after 24 and 48 hours of incubation, as compared to the values for the same amount of Lactobacillus without encapsulation.