298
Views
5
CrossRef citations to date
0
Altmetric
Original

BILATERAL NEPHRECTOMY DELAYS GASTRIC EMPTYING OF A LIQUID MEAL IN AWAKE RATS

, , , , , & show all
Pages 275-284 | Published online: 07 Jul 2009

Figures & data

Figure 1.Effect of bilateral nephrectomy (▪) or sham-operation (□) on the liquid gastric emptying rates in awake rats. The animals were studied 1 day after surgery and sacrificed at 0, 10, 20, 30 or 45 min after liquid meal (1.5 mL of 0.5 mg mL−1 phenol red in 5% glucose solution). Fractional dye recovery was obtained by spectrophotometry from the stomach of sham-operated and nephrectomy groups. Bars represent the gastric emptying (%) mean values while vertical lines means the standard error of mean. n, number of observations. *, P < 0.05 for sham-operation vs. nephrectomy values (ANOVA and Student–Newman–Keuls test).
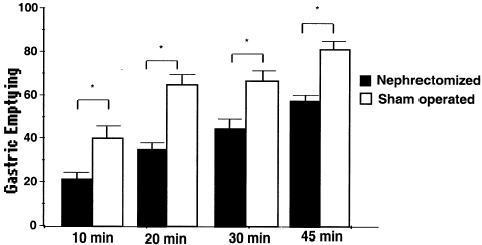
Figure 1.Effect of bilateral nephrectomy (▪) or sham-operation (□) on the liquid gastric emptying rates in awake rats. The animals were studied 1 day after surgery and sacrificed at 0, 10, 20, 30 or 45 min after liquid meal (1.5 mL of 0.5 mg mL−1 phenol red in 5% glucose solution). Fractional dye recovery was obtained by spectrophotometry from the stomach of sham-operated and nephrectomy groups. Bars represent the gastric emptying (%) mean values while vertical lines means the standard error of mean. n, number of observations. *, P < 0.05 for sham-operation vs. nephrectomy values (ANOVA and Student–Newman–Keuls test).

Table 1. Hemodynamic and Biochemical Parameters Profiles from Sham-Operated and Bilateral Nephrectomized Rats

Figure 2. Correlations between gastric dye retention (%) and blood volume (mL/100 g) values obtained from sham-operated and nephrectomized animals. There is a strong correlation (r2 = 0.73) between gastric retention and blood volume in anephric animals (•—•) as indicated by the linear regression equation y = −2.8x + 75.2 while in sham-operated animals (▪—▪) there is no such correlation, according to the regression linear equation y = −1.0x + 73.6, r2 = 0.09.
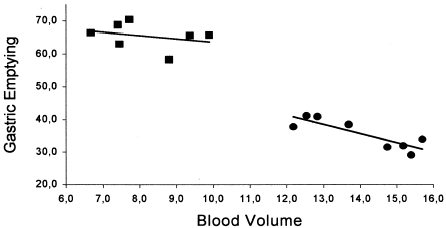
Figure 2. Correlations between gastric dye retention (%) and blood volume (mL/100 g) values obtained from sham-operated and nephrectomized animals. There is a strong correlation (r2 = 0.73) between gastric retention and blood volume in anephric animals (•—•) as indicated by the linear regression equation y = −2.8x + 75.2 while in sham-operated animals (▪—▪) there is no such correlation, according to the regression linear equation y = −1.0x + 73.6, r2 = 0.09.

Reprints and Corporate Permissions

Please note: Selecting permissions does not provide access to the full text of the article, please see our help page How do I view content?

To request a reprint or corporate permissions for this article, please click on the relevant link below:

Academic Permissions

Please note: Selecting permissions does not provide access to the full text of the article, please see our help page How do I view content?

Obtain permissions instantly via Rightslink by clicking on the button below:

If you are unable to obtain permissions via Rightslink, please complete and submit this Permissions form. For more information, please visit our Permissions help page.