349
Views
18
CrossRef citations to date
0
Altmetric
LABORATORY STUDY

The Role of Growth Factors on Renal Tubular Cells Submitted to Hypoxia and Deprived of Glucose

, M.D., Ph.D., , M.S., , M.D., , , Ph.D., , M.D., Ph.D. & , M.D., Ph.D. show all
Pages 341-353 | Published online: 26 Aug 2009

Figures & data

Figure 1. Effects of hypoxia on LDH release in MDCK cells. The cells were cultivated in culture media with glucose and were submitted to hypoxia and the bottles kept sealed for 24 h in the incubator. Data are mean ± SD of culture bottle compared to control group (NS = not significant).
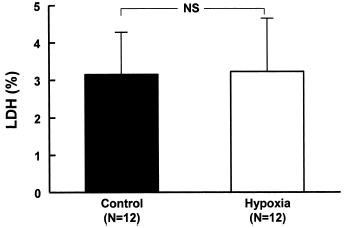
Figure 1. Effects of hypoxia on LDH release in MDCK cells. The cells were cultivated in culture media with glucose and were submitted to hypoxia and the bottles kept sealed for 24 h in the incubator. Data are mean ± SD of culture bottle compared to control group (NS = not significant).

Figure 2. LDH release of MDCK cells deprived of glucose for 24 h and submitted to hypoxia. The cells were washed with PBS and glucose-free culture media was added. Hypoxia was performed and the bottles were immediately sealed to wait 24 h in the incubator. Data are mean ± SD of culture bottle compared to cells deprived glucose only; p<0.05.
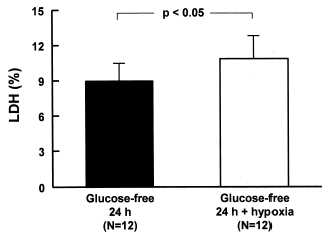
Figure 2. LDH release of MDCK cells deprived of glucose for 24 h and submitted to hypoxia. The cells were washed with PBS and glucose-free culture media was added. Hypoxia was performed and the bottles were immediately sealed to wait 24 h in the incubator. Data are mean ± SD of culture bottle compared to cells deprived glucose only; p<0.05.

Figure 3. LDH release of MDCK cells deprived of glucose for 48 h and submitted to hypoxia. The cells were incubated with glucose-free culture media during 24 h, then the cells were submitted to hypoxia and the bottles were kept sealed for additional 24 h, thereby completing 48 h incubation in a glucose-free culture media, the last 24 h of which were associates with the hypoxia situation. Data are mean ± SD of culture bottle compared to cells deprived glucose only; p<0.05.
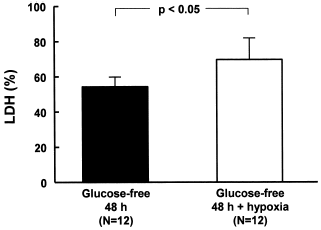
Figure 3. LDH release of MDCK cells deprived of glucose for 48 h and submitted to hypoxia. The cells were incubated with glucose-free culture media during 24 h, then the cells were submitted to hypoxia and the bottles were kept sealed for additional 24 h, thereby completing 48 h incubation in a glucose-free culture media, the last 24 h of which were associates with the hypoxia situation. Data are mean ± SD of culture bottle compared to cells deprived glucose only; p<0.05.

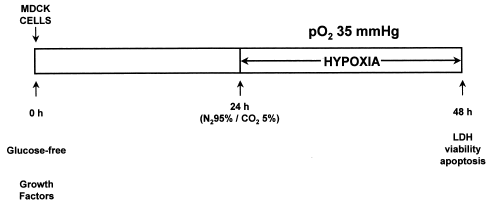
Figure 4. Injury protocol.

Figure 4. Injury protocol.

Figure 5. Effects of growth factors EGF (20 ng/mL), IGF-I (20 ng/mL) or HGF (20 ng/mL) on LDH release in MDCK cells during hypoxic-injury. Data are mean ± SD of culture bottle compared to controls and untreated injury group; *p<0.001 vs. Control; p<0.001 vs. Injury and EGF; p<0.05 vs. IGF-I.

Figure 5. Effects of growth factors EGF (20 ng/mL), IGF-I (20 ng/mL) or HGF (20 ng/mL) on LDH release in MDCK cells during hypoxic-injury. Data are mean ± SD of culture bottle compared to controls and untreated injury group; *p<0.001 vs. Control; †p<0.001 vs. Injury and EGF; †p<0.05 vs. IGF-I.
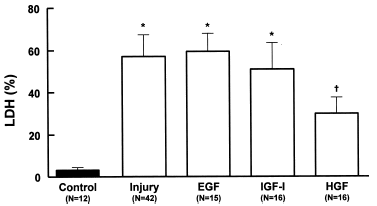
Figure 6. Effects of growth factors EGF (20 ng/mL), IGF-I (20 ng/mL) or HGF (20 ng/mL) on viability (acridine orange plus ethidium bromide) in MDCK cells submitted to hypoxic-injury. Data are mean ± SD of culture bottle compared to controls and untreated injury group; *p<0.001 vs. Control; p<0.01 vs. Injury; p<0.05 vs. EGF.

Figure 6. Effects of growth factors EGF (20 ng/mL), IGF-I (20 ng/mL) or HGF (20 ng/mL) on viability (acridine orange plus ethidium bromide) in MDCK cells submitted to hypoxic-injury. Data are mean ± SD of culture bottle compared to controls and untreated injury group; *p<0.001 vs. Control; †p<0.01 vs. Injury; †p<0.05 vs. EGF.
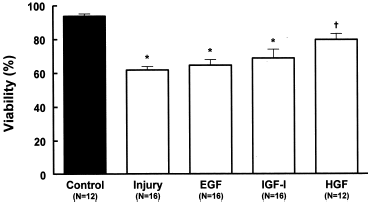
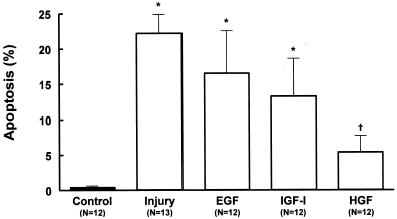
Figure 7. Effects of growth factors EGF (20 ng/mL), IGF-I (20 ng/mL) or HGF (20 ng/mL) on morphologic analysis of apoptosis (Hoechst 33342) in MDCK cells submitted to hypoxic injury. Data are mean ± SD of culture bottle compared to controls and untreated injury group; *p<0.001 vs. Control; p<0.01 vs. Injury; p<0.05 vs. EGF.

Figure 7. Effects of growth factors EGF (20 ng/mL), IGF-I (20 ng/mL) or HGF (20 ng/mL) on morphologic analysis of apoptosis (Hoechst 33342) in MDCK cells submitted to hypoxic injury. Data are mean ± SD of culture bottle compared to controls and untreated injury group; *p<0.001 vs. Control; †p<0.01 vs. Injury; †p<0.05 vs. EGF.
Reprints and Corporate Permissions

Please note: Selecting permissions does not provide access to the full text of the article, please see our help page How do I view content?

To request a reprint or corporate permissions for this article, please click on the relevant link below:

Academic Permissions

Please note: Selecting permissions does not provide access to the full text of the article, please see our help page How do I view content?

Obtain permissions instantly via Rightslink by clicking on the button below:

If you are unable to obtain permissions via Rightslink, please complete and submit this Permissions form. For more information, please visit our Permissions help page.