253
Views
11
CrossRef citations to date
0
Altmetric
LABORATORY STUDY

Early Manifestation of Nephropathy in Rats with Arterial Calcinosis

, , & , Ph.D.
Pages 355-366 | Published online: 26 Aug 2009

Figures & data

Table 1. Systolic arterial pressure, total calcium in aorta and plasma, and plasma lipid profile in control and treated rats (vitamin D3 300,000 IU/kg b.w., i.m., 5 days before the experiment). Results are expressed as means±SD

Figure 1. Renal clearance of SA, renal blood flow and glomerular filtration rate in control and treated rats (vitamin D3 300,000 IU/kg b.w., i.m., 5 days before the experiment). Results are expressed as means ± SEM. (#) p<0.05.
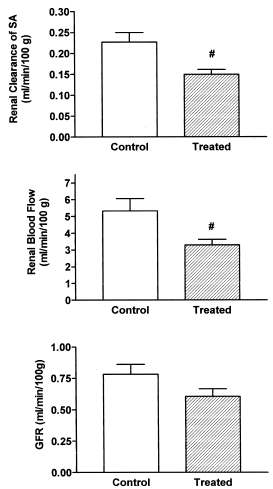
Figure 1. Renal clearance of SA, renal blood flow and glomerular filtration rate in control and treated rats (vitamin D3 300,000 IU/kg b.w., i.m., 5 days before the experiment). Results are expressed as means ± SEM. (#) p<0.05.
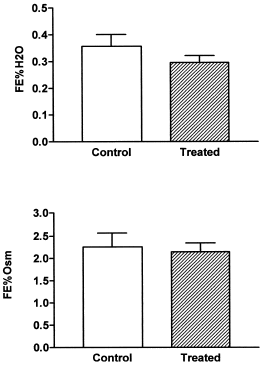
Figure 2. Fractional excretion of water (FE% H2O) and fractional excretion of osmolytes (FE% Osm) in control and treated rats (vitamin D3 300,000 IU/kg b.w., i.m., 5 days before the experiment). Results are expressed as means ± SEM. (#) p<0.05.
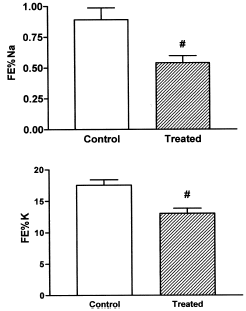
Figure 2. Fractional excretion of water (FE% H2O) and fractional excretion of osmolytes (FE% Osm) in control and treated rats (vitamin D3 300,000 IU/kg b.w., i.m., 5 days before the experiment). Results are expressed as means ± SEM. (#) p<0.05.
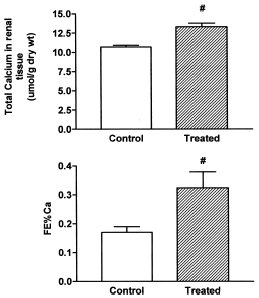
Figure 3. Fractional excretion of sodium (FE% Na) and fractional excretion of potassium (FE% K) in control and treated rats (vitamin D3 300,000 IU/kg b.w., i.m., 5 days before the experiment). Results are expressed as means ± SEM. (#) p<0.05.

Figure 3. Fractional excretion of sodium (FE% Na) and fractional excretion of potassium (FE% K) in control and treated rats (vitamin D3 300,000 IU/kg b.w., i.m., 5 days before the experiment). Results are expressed as means ± SEM. (#) p<0.05.

Figure 4. Total calcium in renal tissue and fractional excretion of calcium (FE% Ca) in control and treated rats (vitamin D3 300,000 IU/kg b.w., i.m., 5 days before the experiment). Results are expressed as means ± SEM. (#) p<0.05.

Figure 4. Total calcium in renal tissue and fractional excretion of calcium (FE% Ca) in control and treated rats (vitamin D3 300,000 IU/kg b.w., i.m., 5 days before the experiment). Results are expressed as means ± SEM. (#) p<0.05.

Figure 5. A: Basolateral membranes (50 ug) from kidneys of control and treated rats were separated on SDS-PAGE. OAT1 was identified using polyclonal antibodies as described in Methods. B: densitometric quantitation of OAT1. Control levels were set at 100%. Each column represents mean ± SEM from experiments carried out in triplicate on 3 different vesicle preparations for each experimental groups. (#) p<0.05.
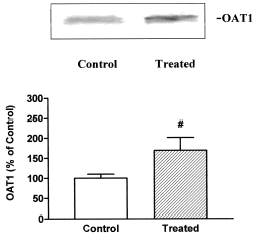
Figure 5. A: Basolateral membranes (50 ug) from kidneys of control and treated rats were separated on SDS-PAGE. OAT1 was identified using polyclonal antibodies as described in Methods. B: densitometric quantitation of OAT1. Control levels were set at 100%. Each column represents mean ± SEM from experiments carried out in triplicate on 3 different vesicle preparations for each experimental groups. (#) p<0.05.

Reprints and Corporate Permissions

Please note: Selecting permissions does not provide access to the full text of the article, please see our help page How do I view content?

To request a reprint or corporate permissions for this article, please click on the relevant link below:

Academic Permissions

Please note: Selecting permissions does not provide access to the full text of the article, please see our help page How do I view content?

Obtain permissions instantly via Rightslink by clicking on the button below:

If you are unable to obtain permissions via Rightslink, please complete and submit this Permissions form. For more information, please visit our Permissions help page.