Figures & data
Figure 1. (A) Cytotoxicity of H2O2 on LLC‐PK1 cells; Cells were treated with 1 mM of H2O2 with and without CT (300 U/mL), CYP2E1 inhibitors, DAS (0.1 mM), DSF (0.1 mM) and DFO (0.4 mM) and incubated for 4 h at 37°C. Cell death was assessed by measurement of LDH release and expressed as a percentage of the positive control (LLC‐PK1 cells incubated with 2% [v/v] Triton X100). Data shown are mean value ± SD of duplicate from four experiments. Significance wasevaluated with student t‐test. *P < 0.001 versus control, +P < 0.005 vs. H2O2, **P < 0.001 vs. H2O2. (B) Effect of CYP2E1 inhibitors, catalase and desferrioxamine on increased CYP2E1 activity caused by H2O2; LLC‐PK1 cells were incubated with H2O2 (1 mM) for 2 h with and without CYP2E1 inhibitors, DAS and DSF (0.1 mM), catalase (300 U/mL) and DFO (0.4 mM). CYP2E1 activity was assessed from the isolated microsomes and expressed as mM/mg/min. Data shown are mean value ± SD of four experiments. *P < 0.01 vs. control, +P < 0.05 vs. H2O2.
![Figure 1. (A) Cytotoxicity of H2O2 on LLC‐PK1 cells; Cells were treated with 1 mM of H2O2 with and without CT (300 U/mL), CYP2E1 inhibitors, DAS (0.1 mM), DSF (0.1 mM) and DFO (0.4 mM) and incubated for 4 h at 37°C. Cell death was assessed by measurement of LDH release and expressed as a percentage of the positive control (LLC‐PK1 cells incubated with 2% [v/v] Triton X100). Data shown are mean value ± SD of duplicate from four experiments. Significance wasevaluated with student t‐test. *P < 0.001 versus control, +P < 0.005 vs. H2O2, **P < 0.001 vs. H2O2. (B) Effect of CYP2E1 inhibitors, catalase and desferrioxamine on increased CYP2E1 activity caused by H2O2; LLC‐PK1 cells were incubated with H2O2 (1 mM) for 2 h with and without CYP2E1 inhibitors, DAS and DSF (0.1 mM), catalase (300 U/mL) and DFO (0.4 mM). CYP2E1 activity was assessed from the isolated microsomes and expressed as mM/mg/min. Data shown are mean value ± SD of four experiments. *P < 0.01 vs. control, +P < 0.05 vs. H2O2.](/cms/asset/42f73fd3-3ca5-4620-b0ee-515b5403487f/irnf_a_11379237_uf0001_b.gif)
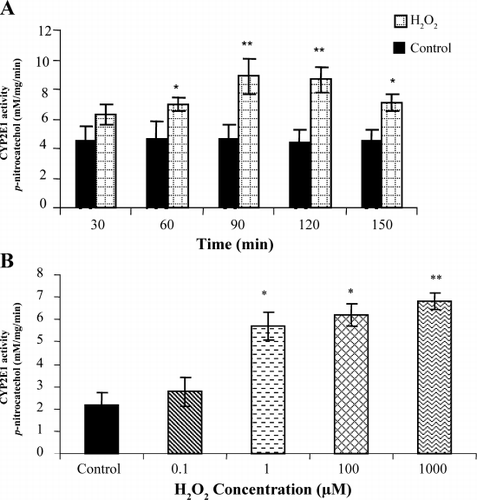
Figure 2. (A) Effect of H2O2 on CYP2E1 activity in LLC‐PK1 cells (increasing time); LLC‐PK1 cells were incubated with H2O2 for increasing time periods. At the end of incubation time, microsomes were isolated as described in Materials and Methods section and used for CYP2E1 activity assessment, which was assessed by measuring the hydroxylation of CYP2E1 substrate, p‐nitrophenol and expressed as mM/mg/min. Data shown are mean value ± SD of four experiments. Significance was evaluated with student t‐test. *P < 0.05 vs. control, **P < 0.01 vs. control. (B) Effect of H2O2 in on CYP2E1 activity in LLC‐PK1 cells (increasing concentration); LLC‐PK1 cells were incubated with H2O2 in dose dependent manner for 2 h. At the end of incubation time, CYP2E1 activity was assessed from the isolated microsomes and expressed as mM/mg/min. Data shown are mean value ± SD of four experiments. Significance was evaluated with student t‐test. *P < 0.05 vs. control, **P < 0.01 vs. control.

