Figures & data
Figure 1. Illustration of the formation process of magnetic, macro/mesoporous bioglasses.
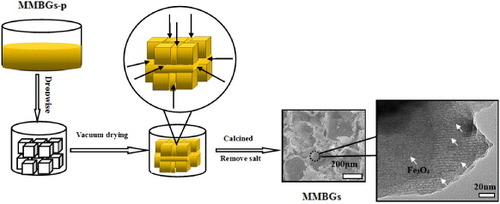
Figure 2. SEM image (a) and EDS analysis (b) of MMBGs.
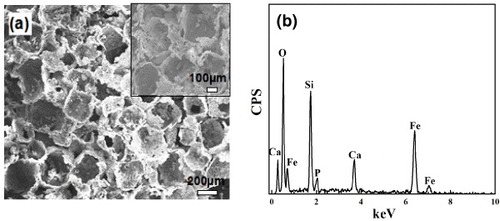
Figure 3. Low-angle XRD patterns and wide-angle XRD patterns of MMBGs1 (a), MMBGs2 (b), MMBGs3 (c) and MMBGs4 (d).
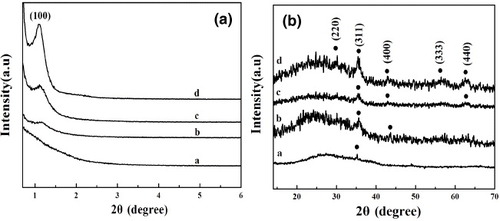
Figure 4. Magnetization curves of four samples at room temperature (a); photograph of dispersed MMBGs2 and MMBGs3 (b), (c) in water before and after being placed near an external magnet.
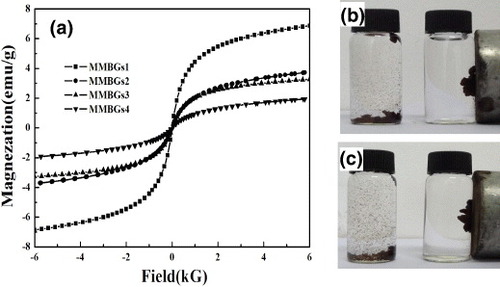
Figure 5. Representative TEM image of the as-synthesized MMBGs2 and MMBGs3. (The arrows indicate the presence of Fe3O4 nanoparticles.)
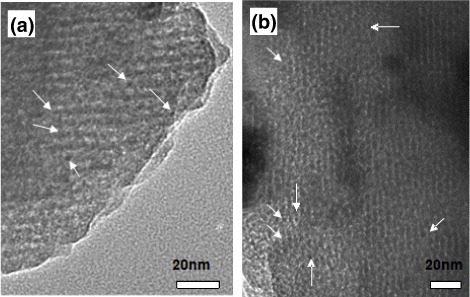
Figure 6. N2 adsorption–desorption isotherms (a) and BJH-pore distribution (b) of MMBGs2 and MMBGs3.
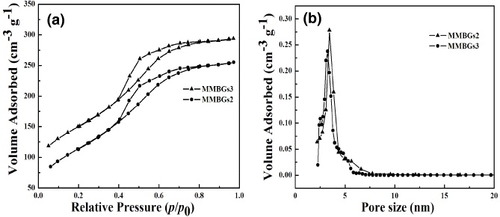
Table 1. Mesopore pore structure parameters, saturation magnetization values and IBU loading of MMBGs2 and MMBGs3.
Figure 7. FTIR spectra of IBU-containing materials: MMBGs2 (a) and MMBGs3 (b).
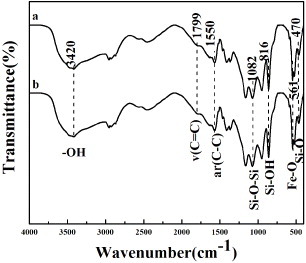
Figure 8. IBU cumulative release of MMBGs2 and MMBGs3 in SBF solution.
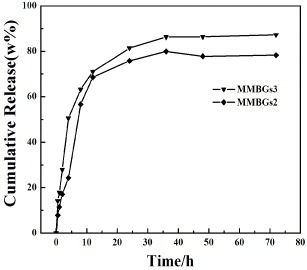
Figure 9. SEM images of the samples: low-resolution image (a), (the inset) high-resolution image of MMBGs2, low-resolution image (b), (the inset) high-resolution image of MMBGs3, EDS patterns of MMBGs2 (c), EDS patterns of MMBGs3 (d) after soaking in SBF for 3 days.
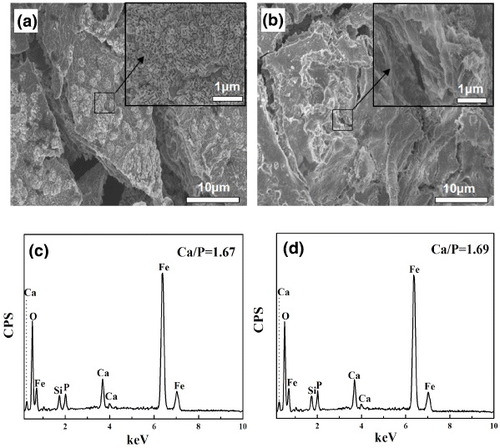
Figure 10. Wide-angle XRD patterns of MMBGs2 (a) and MMBGs3 (b) after soaking in SBF for 3 days. (The circle represents the Fe3O4 characteristic diffraction peak; the triangle represents the HAP characteristic diffraction peak.)
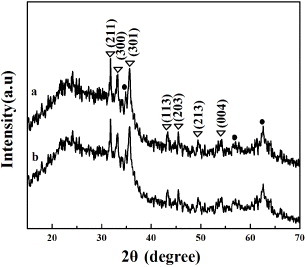
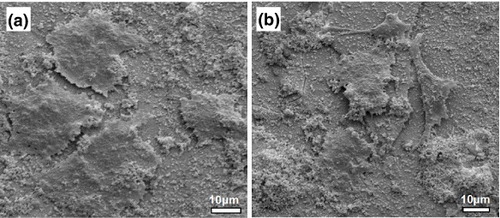
Figure 11. SEM images of HeLa cells morphology onto each surface of MMBGs2 (a) and MMBGs3 (b) after culturing for 3 days.