Figures & data
Table 1. Composition and label of the synthesized systems.
Figure 1. SEM micrographs of: (a) Si/Que5, (b) Si/Que10, and (c) Si/Que15.
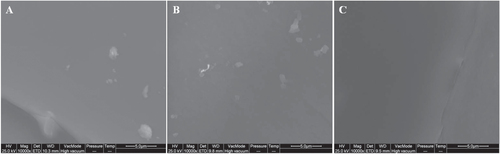
Figure 2. FTIR spectra of (a) pure quercetin, (b) Si/Que hybrid systems. Spectra are vertically shifted for clarity.
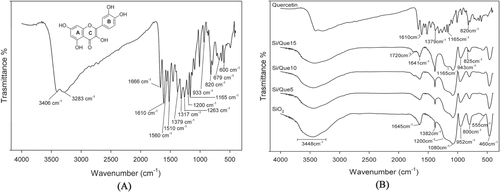
Figure 3. UV–vis spectra of quercetin (solid black curve) and extracts from quercetin-entrapped silica materials (dashed gray curve).
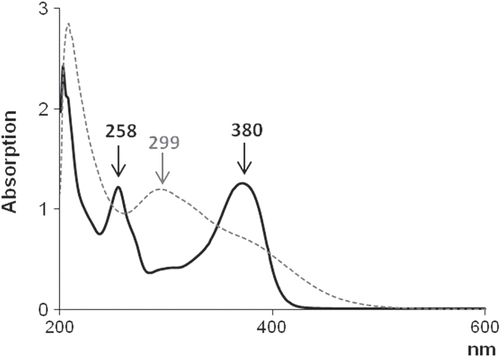
Figure 4. MS/MS spectrum of the protonated quercetin derivative at m/z 359.
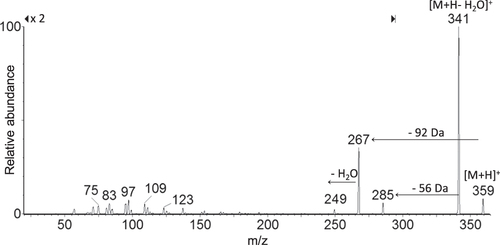
Figure 5. (a) Proposed synthesis pathway of the tentatively identified quercetin derivative. (b) Proposed fragmentation pattern of the tentatively identified quercetin derivative ([M + H]+ at m/z 359).
![Figure 5. (a) Proposed synthesis pathway of the tentatively identified quercetin derivative. (b) Proposed fragmentation pattern of the tentatively identified quercetin derivative ([M + H]+ at m/z 359).](/cms/asset/436bce70-7741-4e87-81df-7ffa3311323d/tsta_a_11661297_f0005_ob.jpg)
Figure 6. Quercetin derivative release from Si/Que5, Si/Que10, and Si/Que15. Values, expressed as quercetin equivalents (Que Eq, mM), are the mean ±standard deviation (SD) of measurements carried out on three samples of each synthesized material analyzed three times.
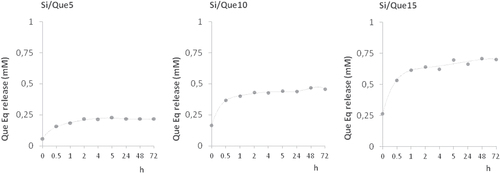
Figure 7. SEM micrographs of Si/Que5, Si/Que10, and Si/Que15 systems after 7 days and 21 days of soaking in SBF. EDS analysis of the globule in the box.
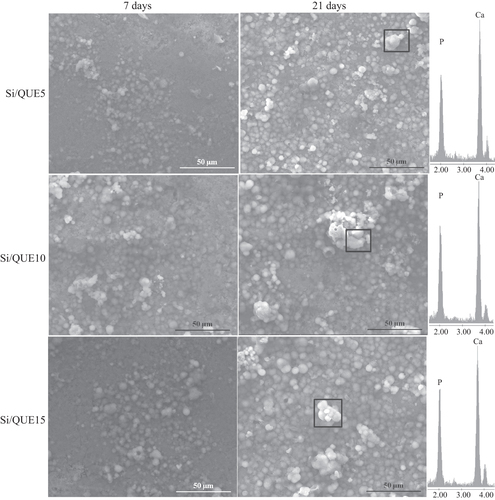
Figure 8. Radical scavenging capacity (RSC, %) of Si/Que5, Si/Que10, and Si/Que15, and silica-free quercetin samples (Que5, Que10, and Que15) towards DPPH• radical, ABTS•+. Values, reported as percentage versus a blank, are the mean ±SD of measurements carried out on three samples (n = 3) analyzed three times.
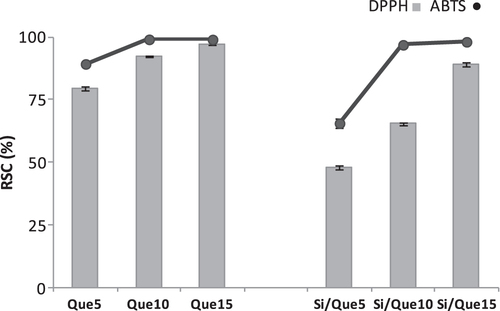
Figure 9. Cell viability (CV, %) toward NIH-3T3 cells of Si/Que5, Si/Que10, and Si/Que15, and silica-free quercetin samples (Que5, Que10, and Que15) at 24 h and 48 h exposure times by means of MTT test results. Values, reported as percentage versus an untreated control, are the mean ±SD of measurements carried out on three samples (n = 3) analyzed 12 times.
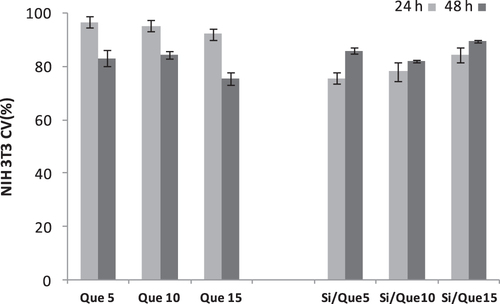
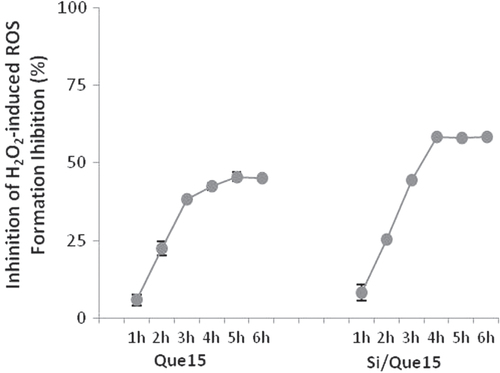
Figure 10. Effect of Que15 and Si/Que15 on H2O2-induced ROS generation in NIH-3T3 cells. Values, reported as percentage versus the oxidized control, are the mean ±SD of measurements carried out on three samples (n = 3) analyzed 12 times.