Figures & data
Figure 1. Schematic representation of the protocol used to prepare cRGD-conjugated PICsomes with tunable cRGD densities (yellow spheres, acetal groups; orange pentagons, cyclic RGD ligands).
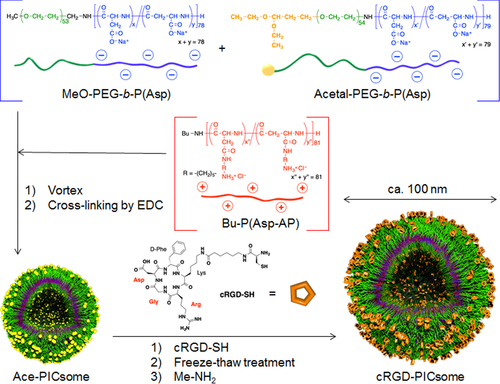
Figure 2. Characterization of the cRGD-PICsomes. (A) 1H NMR spectrum of a cRGD-conjugated PICsome (400 MHz, D2O, 80 °C), (B) a TEM image of uranyl acetate staining (scale bar, 100 nm).
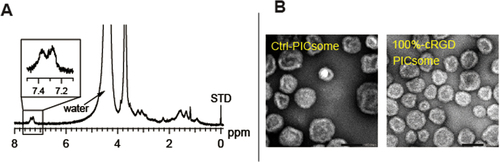
Table 1. Characteristics of the obtained cRGD-conjugated PICsomes.
Figure 3. Uptake of cRGD-PICsomes and Ctrl-PICsomes into HUVECs. (A) High-throughput automated analysis of fluorescence images using an IN Cell Analyzer 1000. Data are presented as the mean ± standard error of the mean (s.e.m.), n = 3. Two-way ANOVA was used to analyze the differences in the fluorescence intensity, and ∗P < 0.005 and ∗∗P < 0.001 were considered significant. (B) Images were captured after a 24 h incubation of HUVECs with PICsomes (red) using confocal laser scanning microscopy (CLSM); nuclei were stained using Hoechst 33342 (blue). Scale bar (white) = 20 μm. CLMS images of 40%-cRGD-PICsomes (C) and 100%-cRGD-PICsomes (D); the late-endosomes and lysosomes were stained using Lyso Tracker Green (green). Scale bar (purple) = 50 μm. (E) Quantitative analysis of fluorescence intensity with quenching method using trypan blue. Data are presented as the mean ± standard deviation, n = 30. The data were analyzed using Student’s t-test, and P∗ < 0.001 was considered significant.
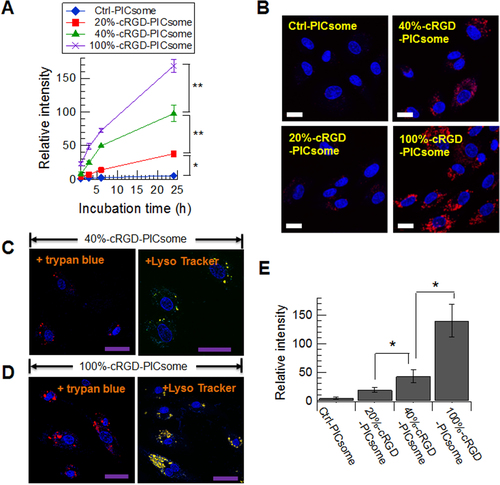
Figure 4. Inhibition of the cellular uptake of cRGD-PICsomes using echistatin in HUVECs. Black line, untreated cells; red line, cells incubated with Cy3-labeled 100%-cRGD-PICsomes; blue line, cells treated with 10 nM echistatin and incubated with Cy3-labeled 100%-cRGD-PICsomes.
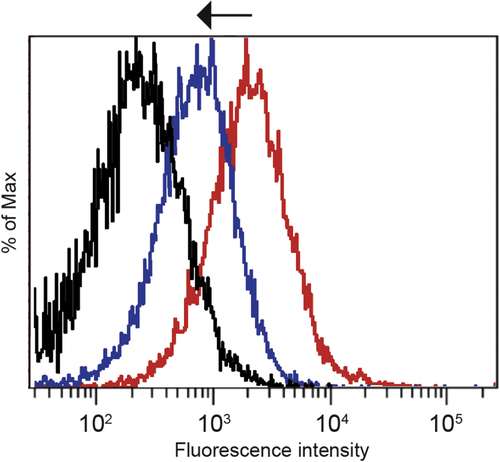
Figure 5. Plasma clearance (A), tumor- (B), and liver- accumulation (C) of PICsomes. Blue line, Ctrl-PICsomes; red line, 20%-cRGD-PICsomes, green line, 40%-cRGD-PICsomes; purple line, 100%-cRGD-PICsomes. The data were analyzed using Student’s t-test. Data are presented as the mean ± s.e.m., n = 4; ∗P < 0.05.
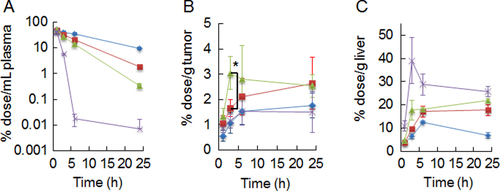
Figure 6. Neovascular-targeting of PICsomes following tail-vein injection. IVCLSM images observed in tumor blood vessels (A) 1 h and (B) 6 h after administration of PICsomes. Red, Cy5-labeled Ctrl-PICsomes; green, DyLight488-labeled 40%-cRGD-PICsomes; yellow, co-localization of red and green signals. Scale bar = 100 μm in all images.
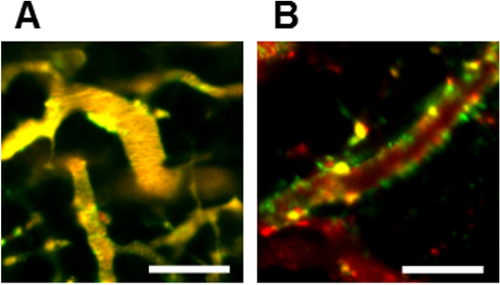
Figure 7. IVCLSM analysis of PICsomes in the tumor vasculature. Blood vessels were pre-stained (blue) with anti-CD31 (PECAM-1) antibodies, and tumor vasculature snapshots were then taken (A) 6 h and (B) 24 h after the administration of 40%-cRGD-PICsomes (red). Scale bar = 100 μm in all images. Co-localizations of blood vessels (blue) and 40%-cRGD-PICsomes (red) in the region selected (indicated by a white rectangle in figures (A) and (B)). (C) Confocal laser scanning microscopy (CLMS) analysis of a tumor section. The tumor was harvested 3 h after injection of 40%-cRGD-PICsomes (red). The vasculature was stained with PECAM-1 (green), and nuclei were stained using Hoechst 33342 (blue). Scale bar = 20 μm.
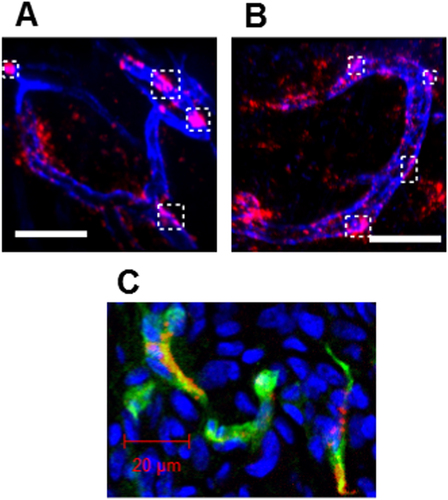
Figure 8. Schematic representation of the method used to prepare SPIO-loaded PICsomes and TEM images of the resulting PICsomes. (A) Schematic representation of the protocol used to prepare SPIO-loaded PICsomes. (B) TEM image of SPIO-loaded 40%-cRGD-PICsomes stained with uranyl acetate. (C) TEM image of unstained SPIO-loaded PICsomes. Scale bars = 100 nm in all images.
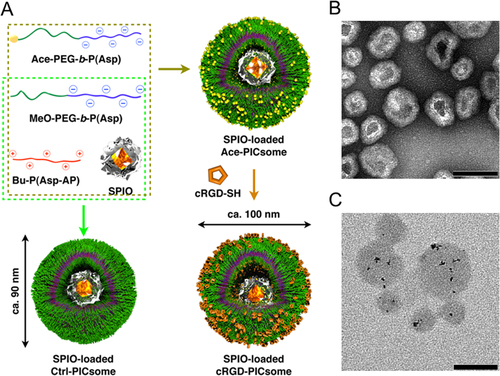
Figure 9. Changes in the normalized R2 value over time in orthotopic tumors in the brain. Quantitative R2 values were normalized to the value obtained before PICsome administration. The data were analyzed using Student’s t-test. Data are presented as the mean ± s.e.m. (n = 4 for 40%-cRGD PICsomes, and n = 3 for Ctrl-PICsomes). ∗P < 0.05.
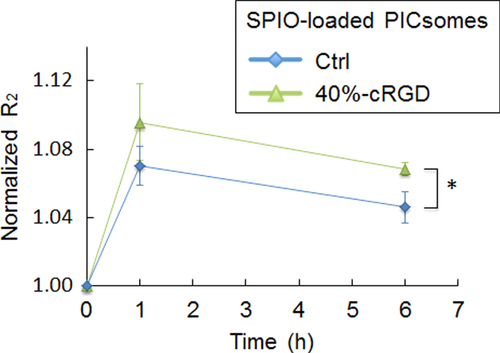
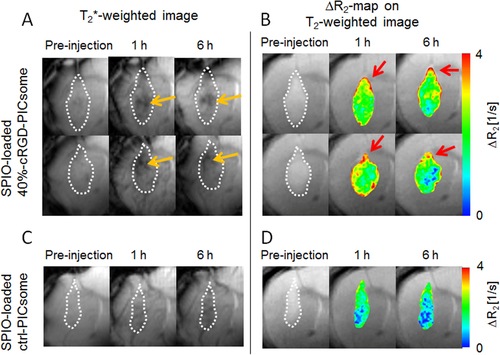
Figure 10. MRI of U87MG orthotopic glioblastoma with SPIO-loaded PICsomes. T2∗-weighted MR images of (A) 40%-cRGD-PICsomes (n = 2) and (C) Ctrl-PICsomes (n = 2) before, and 1 and 6 h after administration. (B) ΔR2 maps in the tumor 1 and 6 h after PICsome administration compared with pre-administration. Tumor lesions were identified using T2-weighted MRI, and are circled with white dashed lines. Orange arrows represent a reduction of the signal of the tumors. Red arrows represent the sites with significantly increased ΔR2 values.