Figures & data
Table 1. Sequences of the primers used for the real-time RT–PCR gene expression quantification
Figure 1. Effects of Dexa and NAC treatment on ROS generation. Total ROS production was measured by DCFH-DA oxidation. Islets were treated with 1 µmol/l of dexamethasone (Dexa) for 72 hours in the presence or absence of 1 mmol/l of NAC (Dexa + NAC) and assayed in the presence of 25 mmol/l glucose. N = 5–8. *P < 0.05, compared to control; ANOVA followed by Bonferroni.
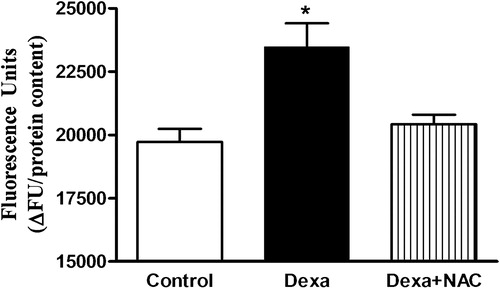
Figure 2. (A) Effects of Dexa and NAC treatment on insulin secretion. Islets were treated with 1 µmol/l of dexamethasone (Dexa) for 72 hours in the presence or absence of 1 mmol/l of NAC (Dexa + NAC). After the culture period, groups of five islets were pre-incubated in Krebs-bicarbonate buffer containing 5.6 mmol/l of glucose and then incubated with 2.8 mmol/l of glucose or 25 mmol/l glucose. After 1 hour of incubation, supernatants were collected and insulin was measured by RIA. N = 20–30. *P < 0.05; ANOVA followed by Bonferroni. (B) Effect of Dexa and NAC on total insulin content in cultured rat islets. After 72 hours of culture, groups of five islets were homogenized and the total insulin content was measured by RIA (N = 18).
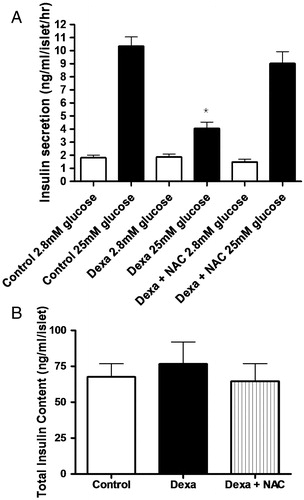
Figure 3. Effects of Dexa and NAC treatment on pancreatic islet cell viability. Islets were treated with 1 µmol/l of dexamethasone for 72 hours in the presence or absence of 1 mmol/l of NAC. NAD(P)H production, as an indicator of viability, was accessed using the MTS method. N = 5. *P < 0.05; ANOVA followed by Bonferroni.
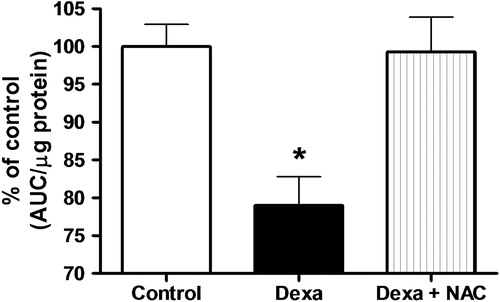
Figure 4. Glucose-induced [Ca+2]i changes in pancreatic islets after 72 hours of dexamethasone and Dexa plus NAC treatment. Bars represent mean values of at least five independent experiments.
![Figure 4. Glucose-induced [Ca+2]i changes in pancreatic islets after 72 hours of dexamethasone and Dexa plus NAC treatment. Bars represent mean values of at least five independent experiments.](/cms/asset/f64129f9-0e56-406b-92bd-1c5f9bed27ed/yrer_a_11679302_f0004_b.jpg)
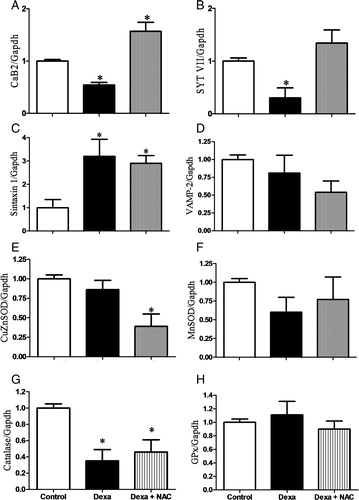
Figure 5. Effects of Dexa and NAC treatment on the gene expressions of (A) calcium channel, voltage-dependent, CaB2, (B) SYT VII, (C) syntaxin 1, (D) VAMP-2, (E) Cu/ZnSOD, (F) MnSOD, (G) catalase, and (H) GPx. After reverse transcription, real-time analyses were performed using Gapdh as an internal control. The experiments were performed after 72 hours of culture. N= 6–8 independent experiments. *P < 0.05, ANOVA followed by Bonferroni.