Figures & data
Figure 1. Chemical structure of AAPH (A) and α-tocotrienol (B).
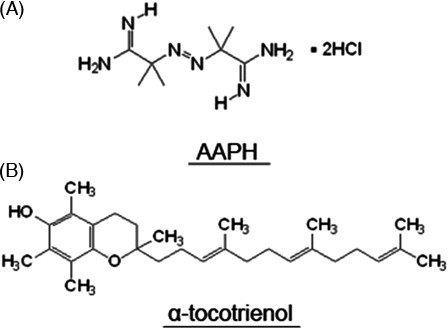
Figure 2. Photomicrographs showing neuro2a cells (A). In order to determine the condition of neurites, phase-contrast photomicrographs of the cells were taken. The scale bar represents 10 µm. AAPH induces death of neuro2a cells (B). Neuro2a cells were treated with various concentrations of AAPH. After 24 hours, the number of dead neuro2a cells was counted using the trypan blue dye exclusion assay. Each point represents the mean of three independent experiments. At least three wells were counted per experiment. Data were analyzed using the Student's t-test (*P < 0.05, **P < 0.01) and one-way ANOVA.
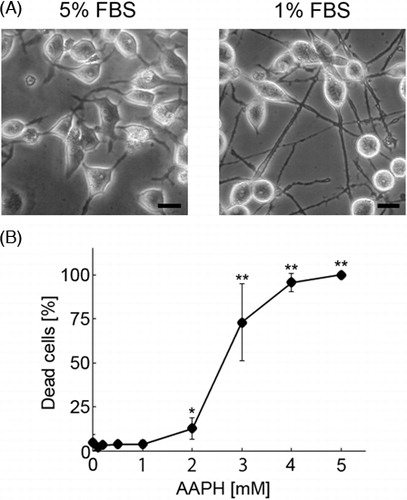
Figure 3. Treatment of neuro2a cells with low concentrations of AAPH induces neurite degeneration. Neuro2a cells were treated with various concentrations of AAPH. After 24 hours, the cells were fixed with 4% paraformaldehyde (PFA) in PBS. Photomicrographs of the cells were collected and analyzed on a personal computer. The scale bar represents 10 µm. Arrows indicate bead formation on the degenerating neurites of neuro2a cells (A). The results of quantitative analysis of neurite degeneration are shown (B). Each column represents the mean of three independent experiments. At least three wells were examined per experiment. Data were analyzed using the Student's t-test (+P < 0.05 between normal neurites at 0 and 1 mM AAPH, and 0 and 2 mM AAPH, respectively. *P < 0.05, **P < 0.01 between altered neurites at 0 and 0.5 mM AAPH, 0 and 0.7 mM AAPH, 0 and 1 mM AAPH, and 0 and 2 mM AAPH. #P < 0.05 between the total number of neurites in neurons treated with 0 and 2 mM AAPH) and one-way ANOVA.
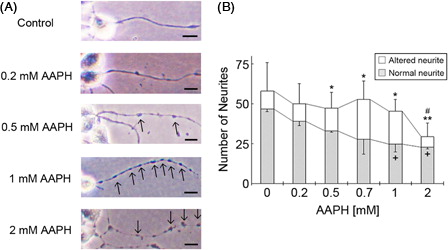
Figure 4. α-Tocotrienol prevents AAPH-induced neurite degeneration. Neuro2a cells were treated with α-tocotrienol (5 µM) in the presence or absence of 1 mM AAPH. After 24 hours, the cells were fixed with 4% PFA in PBS. Photomicrographs of the cells were collected and analyzed on a personal computer. The scale bar represents 10 µm. Arrows indicate bead formation on the degenerating neurites of neuro2a cells (A). The results of quantitative analysis of neurite degeneration are shown (B). Each column represents the mean of three independent experiments. At least three wells were examined per experiment. Data were analyzed using the Student's t-test. ++P < 0.01 between normal control neurites and neurites of neurons treated with 1 mM AAPH. xxP < 0.01 between normal neurites of neurons treated with 5 µM α-tocotrienol in the presence or absence of 1 mM AAPH. **P < 0.01 between altered neurites of control neurons and those of neurons treated with 1 mM AAPH. ##P < 0.01 between altered neurites at 5 µM α-tocotrienol in the presence or absence of 1 mM AAPH.
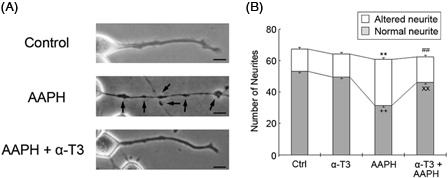
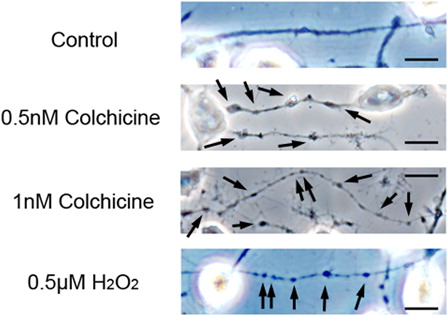
Figure 5. Colchicine induces neurite degeneration. Neuro2a cells were treated with various concentrations of colchicine. After 24 hours, the cells were fixed with 4% PFA in PBS. Photomicrographs of the cells were collected and analyzed on a personal computer. The scale bar represents 10 µm. Arrows indicate bead formation on the degenerating neurites of neuro2a cells. At least three wells were examined per experiment.