Publication Cover
Redox Report
Communications in Free Radical Research
Volume 20, 2015 - Issue 5
4,561
Views
50
CrossRef citations to date
0
Altmetric
Research Articles

N-acetylcysteine for therapy-resistant tobacco use disorder: a pilot study

, , , , , , , & show all

Figures & data

Figure 1. CONSORT flow chart.

Figure 1. CONSORT flow chart.

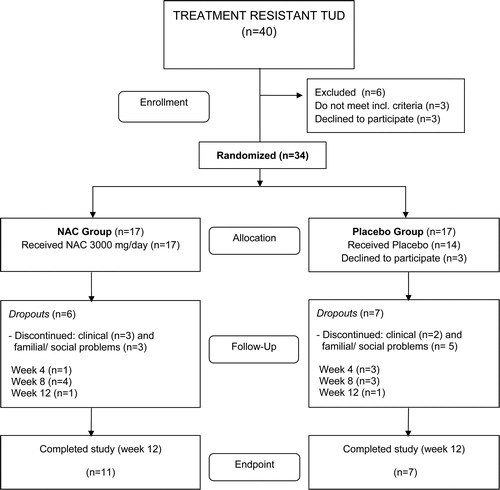
Table 1. Clinical and socio-demographic data of the NAC and placebo treatment groups

Figure 2. The time course data for the effects of NAC versus placebo at the 4 time points (shown are the estimated marginal means with standard error). t0 = baseline, t1 = 4 weeks, t2 = 8 weeks, t3 = 12 weeks.

Figure 2. The time course data for the effects of NAC versus placebo at the 4 time points (shown are the estimated marginal means with standard error). t0 = baseline, t1 = 4 weeks, t2 = 8 weeks, t3 = 12 weeks.

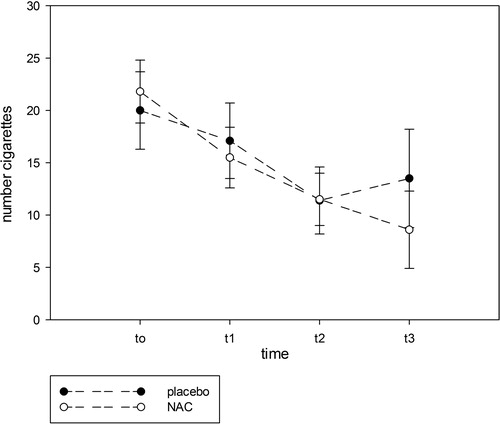
Table 2. Effects of treatments on outcome measurements

Table 3. Side effects reported during the course of the study

Reprints and Corporate Permissions

Please note: Selecting permissions does not provide access to the full text of the article, please see our help page How do I view content?

To request a reprint or corporate permissions for this article, please click on the relevant link below:

Academic Permissions

Please note: Selecting permissions does not provide access to the full text of the article, please see our help page How do I view content?

Obtain permissions instantly via Rightslink by clicking on the button below:

If you are unable to obtain permissions via Rightslink, please complete and submit this Permissions form. For more information, please visit our Permissions help page.