
Figures & data
Table 1. Experimental design
Figure 1. TACCUPRAC/AOP of erythrocytes isolated from stored blood with VC. Values are expressed as mean ± SE from five samples. VC 10, vitamin C (10 mM); VC 30, vitamin C (30 mM); VC 60, vitamin C (60 mM). Changes are analyzed by two-way ANOVA followed by Bonferroni's post-test using Graphpad Prism software. P < 0.05 was considered significant. Values between groups are represented in upper case, while values within a group are represented in lower case. Those not sharing the same letters are significant.
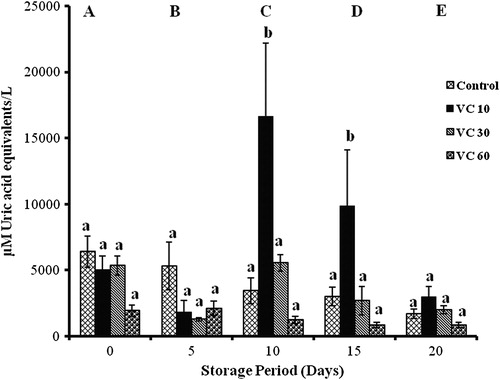
Figure 2. TACCUPRAC/AOP of erythrocytes isolated from stored blood with LC. Values are expressed as mean ± SE from five samples. LC 10, L-carnitine (10 mM); LC 30, L-carnitine (30 mM); LC 60, L-carnitine (60 mM). Changes are analyzed by two-way ANOVA followed by Bonferroni's post-test using Graphpad Prism software. P < 0.05 was considered significant. Values between groups are represented in upper case, while values within a group are represented in lower case. Those not sharing the same letters are significant.
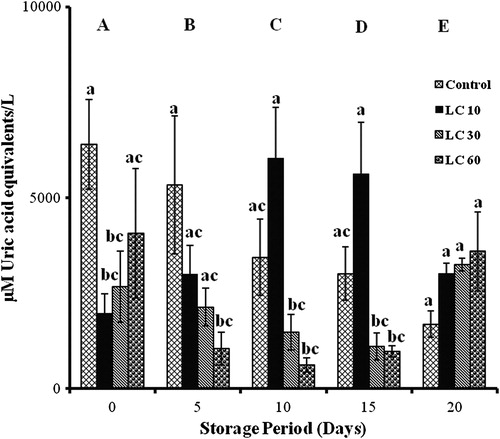
Figure 3. TACCUPRAC/AOP of erythrocytes isolated from stored blood with curcumin. Values are expressed as mean ± SE from five samples. Cur 10, curcumin (10 mM); Cur 30, curcumin (30 mM); Cur 60, curcumin (60 mM). Changes are analyzed by two-way ANOVA followed by Bonferroni's post-test using Graphpad Prism software. P < 0.05 was considered significant. Values between groups are represented in upper case, while values within a group are represented in lower case. Those not sharing the same letters are significant.
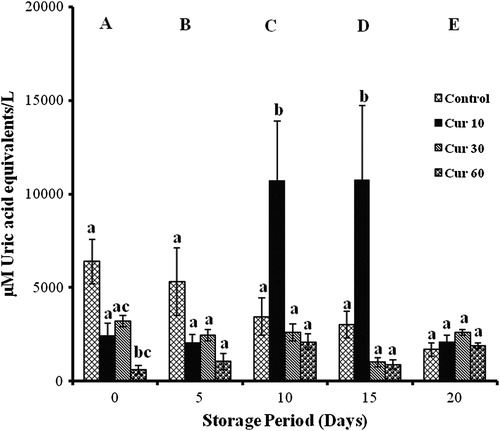
Figure 4. AOA of erythrocytes isolated from stored blood with VC. Values are expressed as mean ± SE from five samples. VC 10, vitamin C (10 mM); VC 30, vitamin C (30 mM); VC 60, vitamin C (60 mM). Changes are analyzed by two-way ANOVA followed by Bonferroni's post-test using Graphpad Prism software. P < 0.05 was considered significant. Values between groups are represented in upper case, while values within a group are represented in lower case. Those not sharing the same letters are significant.
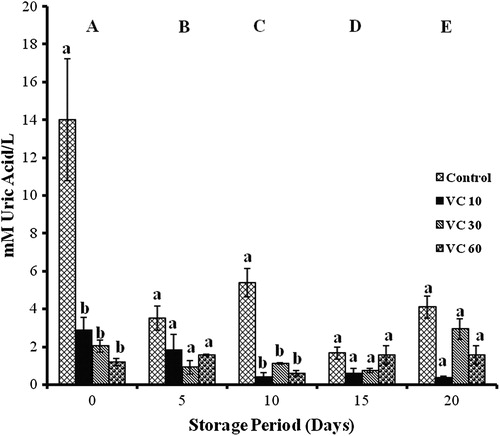
Figure 5. AOA of erythrocytes isolated from stored blood with LC. Values are expressed as mean ± SE from five samples. LC 10, L-carnitine (10 mM); LC 30, L-carnitine (30 mM); LC 60, L-carnitine (60 mM). Changes are analyzed by two-way ANOVA followed by Bonferroni's post-test using Graphpad Prism software. P < 0.05 was considered significant. Values between groups are represented in upper case, while values within a group are represented in lower case. Those not sharing the same letters are significant.
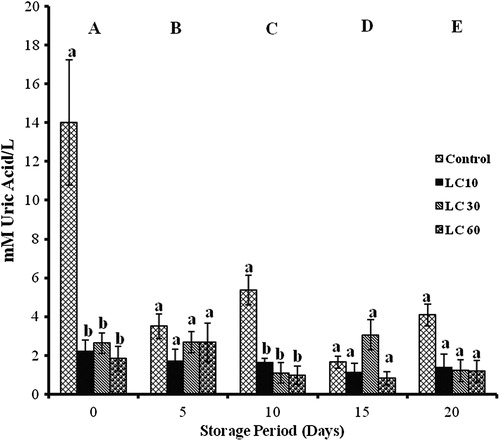
Figure 6. AOA of erythrocytes isolated from stored blood with curcumin. Values are expressed as mean ± SE from five samples. Cur 10, curcumin (10 mM); Cur 30, curcumin (30 mM); Cur 60, curcumin (60 mM). Changes are analyzed by two-way ANOVA followed by Bonferroni's post-test using Graphpad Prism software. P < 0.05 was considered significant. Values between groups are represented in upper case, while values within a group are represented in lower case. Those not sharing the same letters are significant.
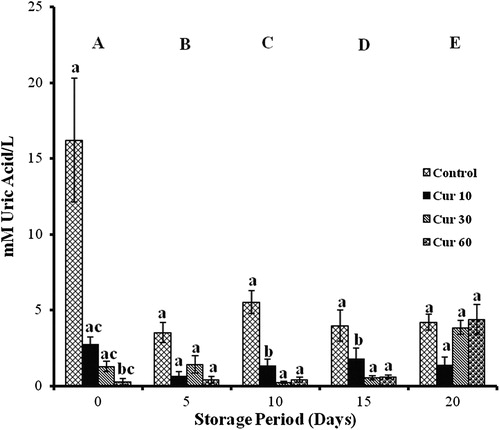
Figure 7. DCFH-DA results of erythrocytes isolated from stored blood. Values are expressed as mean ± SE from five samples. Changes are analyzed by two-way ANOVA followed by Bonferroni's post-test using Graphpad Prism software. P < 0.05 was considered significant. Values between groups are represented in upper case, while values within a group are represented in lower case. Those not sharing the same letters are significant.
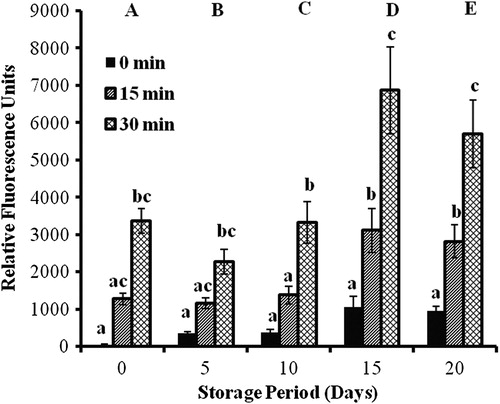
Table 2. DCFH-DA results of stored erythrocytes with antioxidants