Figures & data
Figure 1. Summary of the Oncology Analyzer methodology. *Participation in the panel was restricted to physicians who could be expected to include the target number of 15 patients for each quarter.
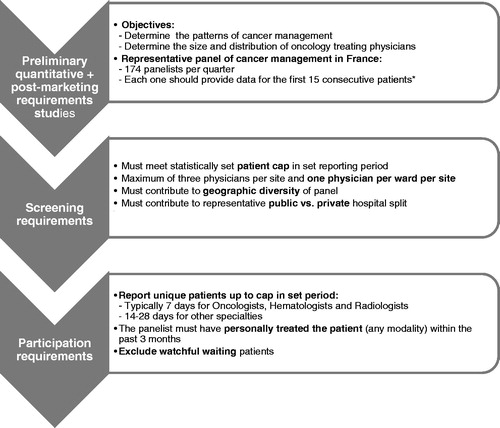
Table 1. Treatment categories used in the analyses according to EphMRA classification.
Figure 2. Flow chart of patients included in the analyses between October 2011 and September 2012.*Figures presented are for those included in Oncology Analyzer between October 2011 (4Q2011) and September 2012 (3Q2012). †Intravenous treatments were defined as intravenous, bolus, infusion or continuous infusion. ‡Patients treated with other treatments (i.e. radiotherapy and surgery) and treated with chemotherapy by other route of administration (subcutaneous, intravesical…) were excluded from the analysis. $ATC codes B3C, L3A1, A4A, N1A2, N2A, N2B, M5B4 and M5B9 were excluded from the analysis.
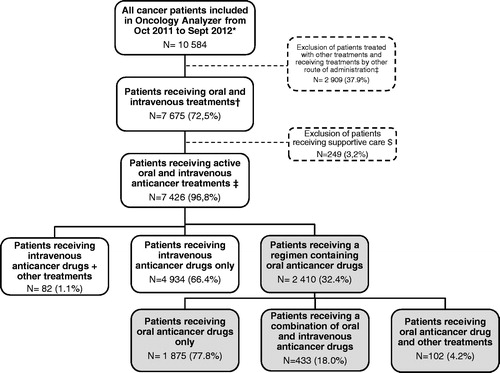
Figure 3. Trend in the use of oral anticancer treatments between October 2004 and September 2012.
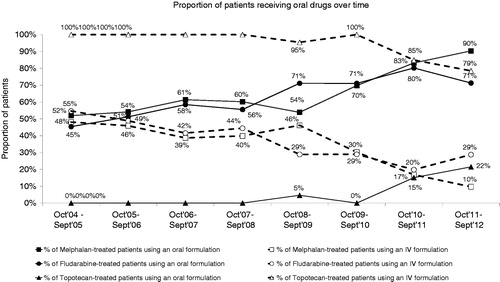
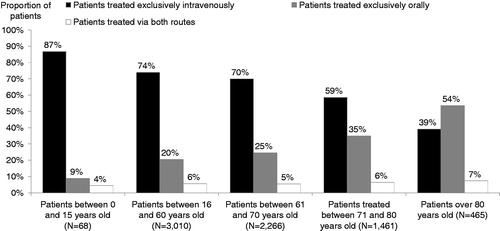
Figure 4. Age distribution and route of treatment administration for patients included between October 2011 and September 2012.