Figures & data
Table 1. Demographic and baseline characteristics (double-blind baseline).
Figure 1. Mean change from double-blind baseline in UPDRS II + III for patients with early PD (HY 1–2). UPDRS II + III total score possible range 0 – 160.
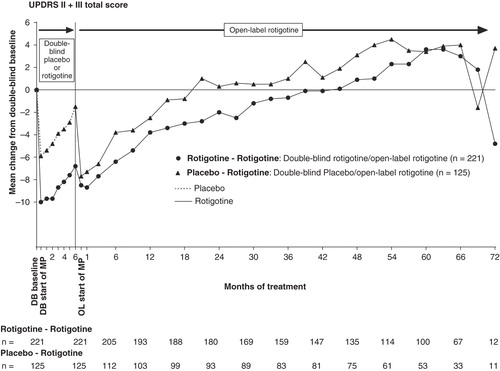
Figure 2. Mean change from double-blind baseline in (A) UPDRS II and (B) UPDRS III for patients with early PD (HY 1–2). UPDRS II is measured on a scale from 0 to 52 points, and UPDRS III measured on a scale from 0 to 108 points.
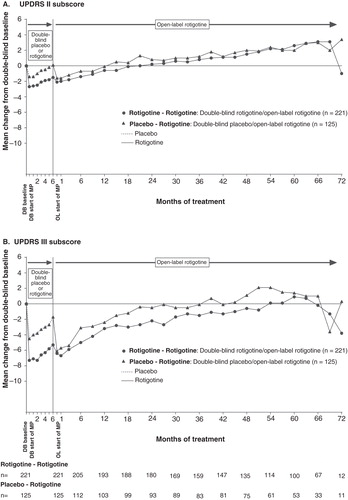
Figure 3. Kaplan–Meier plot for time to first return to double-blind baseline UPDRS II + III for patients with early PD (HY 1–2). The Kaplan–Meier curve is calculated from the total number of patients at risk of returning to ≥ double-blind baseline UPDRS II + III value at each time point. Patients at risk are those remaining in the study and who have not returned to ≥ double-blind baseline UPDRS II + III value.
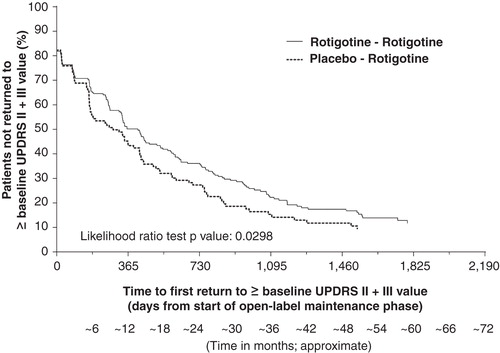
Table 2. Rotigotine and levodopa exposure over the course of the open-label studies.
Figure 4. (A) Mean rotigotine dose and (B) mean levodopa dose over the course of the open-label studies for patients with early PD (HY 1–2).
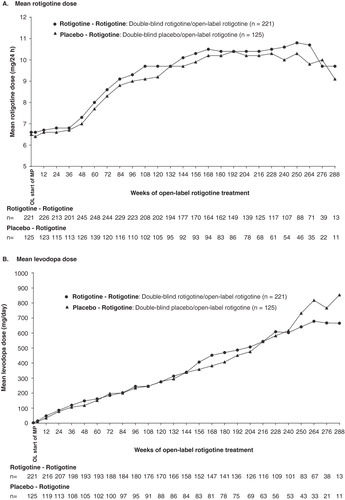
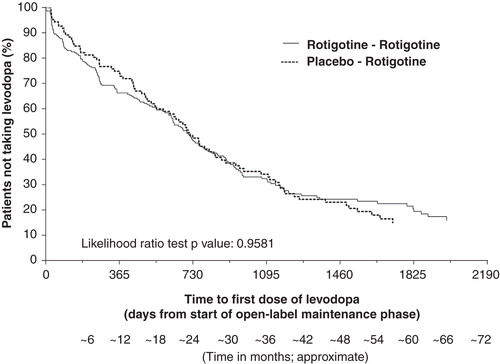
Figure 5. Kaplan–Meier plot for time to first levodopa use during open-label study for patients with early PD (HY 1–2). The Kaplan–Meier curve is calculated from the total number of patients at risk of receiving their first dose of levodopa at each time point. Patients at risk are those remaining in the study and who have not received levodopa.