
Figures & data
Figure 1. Schematic view of the xenogenous-based bovine-pure PG preparation and its embedding with the CI. Peripheral blood was obtained by i.v. catheterization of the healthy bovine and was transferred to the EDTA tubes. The samples were centrifuged in two steps. After the first-step centrifugation, three layers are formed including PPP, PRP + WBCs = buffy coat and RBCs. The PPP and buffy coat layers were suctioned and transferred into a new tube but the RBCs were discarded. The PPP and buffy coat were centrifuged again (second step centrifugation). This resulted in formation of three layers including PPP, PRP and WBC. WBCs were discarded, but the PPP and PRP were suctioned into the sterile tubes. The solution was mixed and lyophilized to concentrate the platelets and produce a lyophilized platelet powder. The powder was then sterilized by UV irradiation, and it was then solved in sterile phosphate buffer saline to produce the desired concentration (six to seven times more than that of the normal blood concentration). The sterile fully dehydrated three-dimensional CI was immersed in the PRP solution, and the implant was left to absorb the platelets in its architecture. The PRP solution was then activated, using bovine thrombin and CaCl2. Therefore, the absorbed PRP in the CI was activated and the gel was formed in the CI. The final product was a PG embedded within the CI. Each arrow shows a subsequent step.
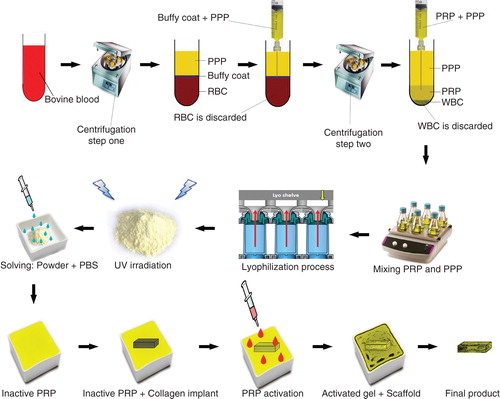
Figure 2. A. A SEM of the PG embedded within the CI. Note that the platelets (arrows) are well attached to the collagen fibers (arrow head) of the bioimplant. B. In a larger magnification, the activated platelets (thick arrow) are attached to the fibrin matrix (arrow head) and the collagen fibers of the implant (thin arrow). C. A SEM of the activated and accumulated platelets. D. Cytological figure of the bovine platelets after the second step centrifugation. Note that the cytological section is filled with only the platelets. E. The cytologic section of the bovine PRP under polarized microscope. F. The TEM of the bovine platelets after the second centrifugation. Scale bar: A, 1 µm; B, 750 nm; C, 500 nm; D, 3 µm; E, 12 µm; F, 630 nm.
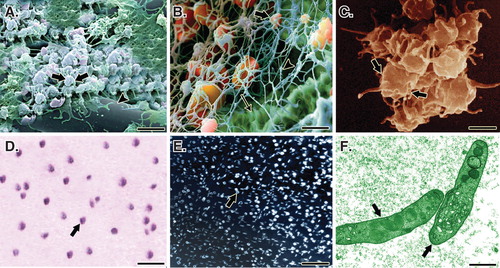
Figure 3. Schematic description of grouping details and evaluation methods.
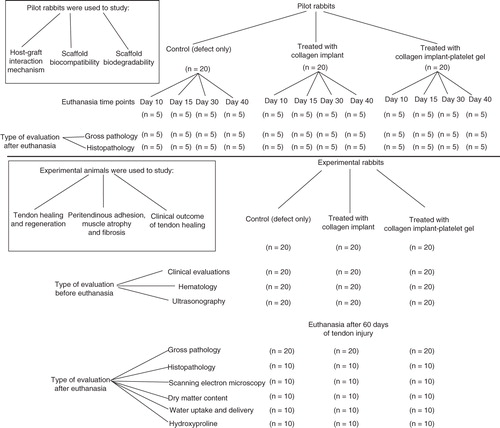
Figure 4. Induction of tendon defect and surgical reconstruction. A. The surgical site and preparation method. B. Skin incision and exposure of the Achilles apparatus. C. Black arrows show the gastroc-soleus muscle proximally and calcaneal tuberosity distally. The red arrow shows the Achilles apparatus, blue arrows show the segment to be removed and the yellow arrow shows the tibialis posterior tendon. D and E. Two centimeters of the Achilles tendon was measured with a digital caliper and removed. F. A modified Kessler Core pattern suture was anchored at the edges of the remaining tendon. G and H. The collagen and collagen-PG implant was inserted.
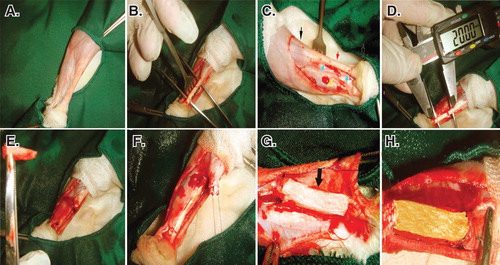
Figure 5. Cell viability was determined by live/dead cell assay using fluorescein diacetate (live) and propidium iodide (dead). A to C. Rat fibroblasts that have been grown throughout the CI after 5, 10 and 20 days of cell seeding, respectively. D to F. Rat fibroblasts that have been grown throughout the collagen-platelet implant after 5, 10 and 20 days of cell seeding, respectively. The bovine xenogenous-based platelets in the collagen scaffold improved cell cytocompatibility of the implant because less dead cells (red) could be seen (D to F) when compared to the collagen scaffold alone (A to C). G to I. Fluorescence microscopy images of the fixed rat fibroblasts on culture medium, collagen scaffold and collagen-PG scaffolds, with rabbit anti-GRP 78 conjugated with Alexa 488 goat anti-rabbit (green)/DAPI (blue)-stained cells after 20 days of cell seeding and culture. J to L. SEM images of the rat fibroblasts cultured on culture medium, collagen scaffold and collagen-PG scaffolds after 20 days of cell seeding. Note that the PG enhanced cellular proliferation, maturation and matrix production. Scale bar: A to F: 100 µm, G to I: 25 µm and J to L: 50 µm.
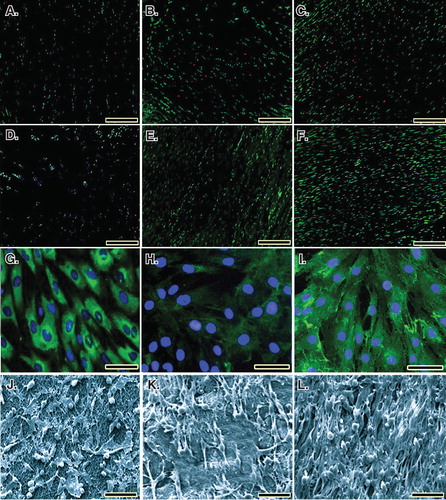
Table 1. Scored values.
Figure 6. Clinical measurements. Note that the xenogenous-based bovine platelets embedded within the CI significantly increased the TD and ST of the injured area during the first 2 weeks after surgical operation as compared with the controls. These factors then gradually reduced to normal level up to 60 days of tendon injury. Hematological parameters of the injured animals: Note that surgical operation and implantation of the scaffolds did not alter the RBCs. The platelets decreased in all the groups after 10 days of surgical operation but unlike the controls, those animals treated with collagen-platelet implant showed normal platelet level at 60 days post-injury. Implantation of the collagen scaffold and collagen-platelet construct reduced WBCs in the blood of the treated animals compared to the control group at 10 days post-injury but the platelets returned to normal value at 60 days Post-injury. Ten days after tendon injury, the treated animals with collagen-platelet scaffold showed higher lymphocyte and lower neutrophil counts compared to the controls but at 60 days post-injury, the lymphocytes were still lower but the neutrophils increased to normal value.
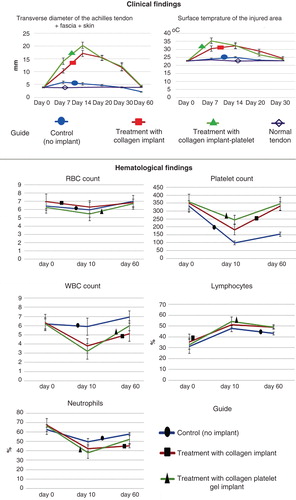
Figure 7. Ultrasonographical characteristics of the injured and normal tendons. Longitudinal sections. A to D are regular ultrasonographs, while E to H are inverted ultrasonographs. Red border (inner border) shows the tendon, while the yellow or outer outline shows the peritendinous adhesions in the healing tendon (A to C) and the paratenon in the normal tendon (D). Arrows head show the tendinous tissue within the defect area or the contralateral part (E to H), while the arrows show the peritendinous adhesions (E to G) and paratenon (H). In the ICTs (A and E), the healing regenerated tissue in the defect area shows hypoechogenicity, irregularity and an amputated echo texture pattern is seen around the tendon. Treatment with CI alone, improved the echogenicity and homogenicity of the healing tendon and also reduced peritendinous adhesion (B and F). Compared to the controls (defect and CI alone), treatment with collagen-platelet implant markedly improved the echogenicity, homogenicity and alignment of the newly developed tendon in the injured area and it also considerably decreased the peritendinous adhesions (C and G). Normal ultrasonographic pattern of the rabbit’s Achilles tendon is provided for comparison (D and H).
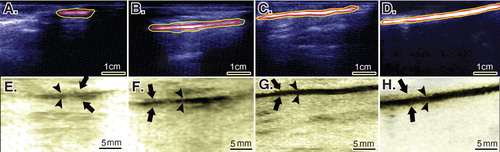
Figure 8. Gross morphologic features of the injured tendons at various stages of tendon healing. Note that no tendinous tissue has been formed in the ICTs (no implant), while a tendon has been formed in those groups treated with collagen and collagen-platelet scaffolds. Compared to the CI alone, treatment with the collagen-platelet implant considerably increased the rate of implant absorption and matrix replacement, it also improved the surface quality, fibrous density and reduced hyperemia and tendon adhesion to the surrounding structures. Bovine platelet also reduced muscle atrophy and fibrosis compared to the controls.
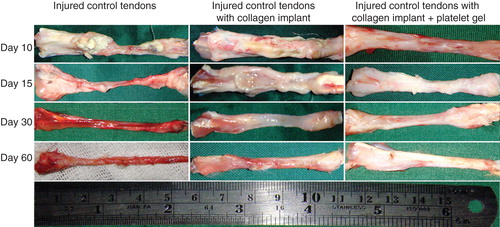
Figure 9. Sixty days after tendon injury, bovine xenogenous-based platelets embedded within the CI significantly improved the dry matter and hydroxyproline content when compared with the controls (those treated with no implant and CI). At this stage, those treated with collagen-platelet scaffold showed more similar pattern of water uptake and delivery to normal tendons compared to the controls (no implant and CI alone).
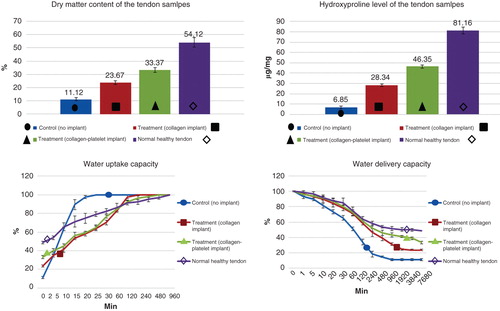
Figure 10. Histopathologic features of the healing injured tendons at 10 – 40 days post-injury (DPI). A to D are ICTs, E to H are ITTCs, I to L are ITTC-Ps. A, E and I = 10 DPI; B, F and J = 15 DPI; C, G and K = 30 DPI; D, H, L = 40 DPI. Compared to the ICTs, implantation of the CI significantly increased migration and proliferation of the inflammatory cells in the injured area at 10 DPI (E). At 15 DPI (F), the inflammatory cells lysed some parts of the CI but these cells were still accumulated in some part of the CI. At 30 DPI, most parts of the CI degraded but few remnants incorporated with the newly developed connective tissue (N.C.T.). At 40 DPI, the preserved parts have been accepted as a part of tendon but the new tissue covering these remnants was still immature in nature (H). Compared to the ITTCs, treatment with platelets, considerably, improved the inflammatory cells infiltration so that the cells were well infiltrated all over the scaffold at 10 DPI (I), following no inflammatory cells accumulation at 15 DPI (J) so that the collagen remnants were free of inflammation. At 30 DPI, the collagen remnants (C.R.) were well accepted as parts of new tendon and a well-vascularized newly developed connective tissue regenerated between these remnants (K). At 40 DPI, the new connective tissue covering the accepted parts of the scaffold was considerably more mature than those seen in the ITTCs (H). Compared to the ICTs, the implants increased the inflammatory response at earlier stages of tendon healing which promoted a stronger fibrous response in the treated lesions. Scale bar A to D, E, I and J = 50 µm; F, G, H and L = 25 µm. Color staining = H&E.
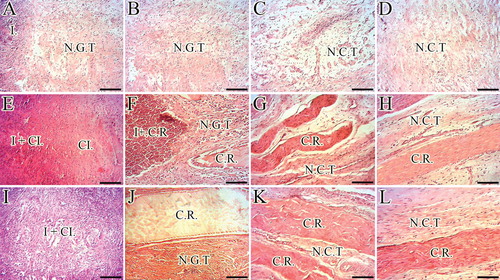
Figure 11. Histopathology sections of the injured and normal tendons at 60 days post-injury (DPI). A to D. Longitudinal sections of the tendons, scale bar = 50 µm. E to H. Longitudinal sections of tendons, scale bar = 12.5 µm. I to L. Transverse sections of the tendons, scale bar = 50 µm. M to P. Transverse sections of gastroc-soleus muscle, scale bar = 50 µm. A, E, I and M are ICTs (no implant); B, F, J and N are injured treated tendons with collagen implant (ITTCs); C, G, K and O are ITTC-Ps and D, H, L and P are normal contralateral healthy tendons (NCTs), for comparison. At 60 DPI, no tendinous tissue was formed in the ICTs (A) so that the density of the collagenous matrix was low (A) and the collagen-like fibers were randomly orientated at different directions (A). The cells in these tendons were immature tenoblasts (E, thin arrow) and no signs of cell alignment was seen (E). The newly developed vessels in these tendons were small and immature (I, arrows) and the muscle fibrosis and atrophy was obvious in this group (M, arrow shows a muscle fiber). In contrast to the ICTs, the collagen fibers formed in an aligned manner in the ITTCs and ITTC-Ps, (B and C, long arrows show the direction of the collagen fibers), the cells were mostly mature tenoblasts (arrow head) and tenocytes (thick arrow) and larger and mature vessels were regenerated in the injured area (J and K, arrows). The muscle fibrosis and atrophy were less than ICTs (N and O, arrows show muscle fibers). Compared to the ITTCs, the ITTC-Ps showed higher degree of collagen and cellular maturation and alignment, larger and thicker vessels and less muscle fibrosis and atrophy. Color staining = H&E.
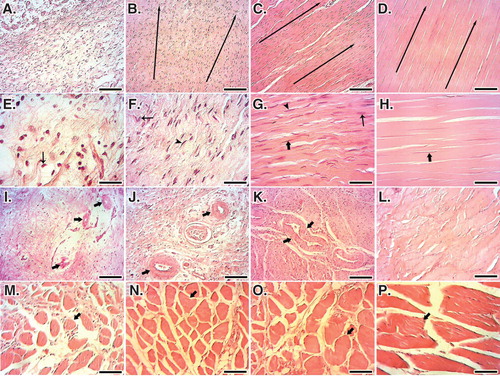
Table 2. Histopathologic characteristics of the injured healing tendons after 60 days of tendon injury and surgical operation.
Figure 12. SEM characteristics of the injured and normal tendons at 60 days post-injury. A, E and I are injured control (no implant) tendons (ICTs). B, F and J are injured treated tendons with collagen implant (ITTCs). C, G and K are ITTC-Ps. D, H and L are normal healthy tendons for comparison. A – H are SEM figures at fiber level, while I to L are the SEM ultramicrographs at fibrillar level. Compared to the ICTs, those tendons treated with implants showed some degrees of collagen fibrils to fiber differentiation and fibrillar and fiber alignment. Compared to the ITTCs, treatment with platelets considerably improved collagen fiber formation (G vs F), collagen density and fiber and fibril alignment in the ITTC-Ps. Scale bar: A to D = 50 µm; E – H = 25 µm and I – L = 5 µm.
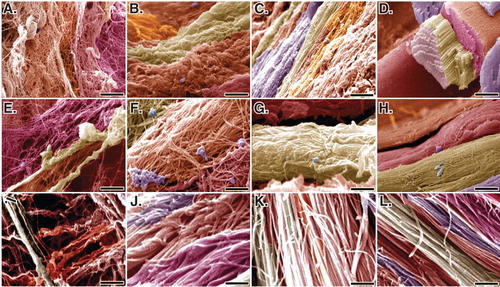
Table 3. SEM characteristics of the injured healing tendons after 60 days of tendon injury and surgical operation.