
Figures & data
Figure 1. Fenofibrate inhibits penetration of endothelial layers by DU-145 cells. A. DU-145 cells (marked with *) were seeded onto the monolayer of HUVECs (98% confluence, serum-free; left) at the density of 1300 cells/cm2 in the absence (middle) or presence of 25 μM FF (right). After 6 h, specimens were fixed with 3.7% FA, permeabilized, stained for VE-cadherin (upper panel) or ZO-1 (lower panel) and counterstained with Hoechst33258. B. Representative XY and XZ reconstructions of transmigrating DU-145 cells registered 1, 6 and 24 h. after seeding in the absence of FF. DU-145 cells were stained with CellTracker, seeded and fixed as in A, stained against F-actin, counterstained with Hoechst33258 and visualized with confocal laser scanning microscopy. Transendothelial penetration indices were estimated for DU-145 cells seeded onto the HUVEC monolayer in the absence and presence of FF at the indicated time points. Statistical significance versus the relevant control at p < 0.01 (t-Student test, n = 3). Scale bar - 40 μm. Note that attenuating effect of FF on a disruption of intercellular contacts within the endothelium in the proximity of DU-145 correlates with delayed penetration of DU-145 through endothelial layers in the presence of 25 μM FF. All results are representative of three independent experiments.
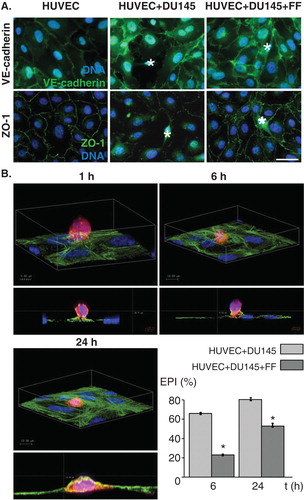
Figure 2. Fenofibrate evokes cytoskeletal rearrangements and reduces DU-145-induced HUVEC motility. A. DU-145 cells (marked with *) were seeded onto the monolayer of HUVECs at the density of 1300 cells/cm2 in the absence (upper right), in the presence of 25 μM FF (lower left), or in the presence of 25 μM FF and 10 μM GW9662 (lower right). After 24 h, specimens were fixed with 3.7% FA, permeabilized, and stained for F-actin and vinculin. A number of FAs per single cell was calculated and plotted from TIRF photomicrographs. Statistical significance versus the relevant control at p < 0.01 (Student’s t-test, n = 3). B. HUVEC motility was visualized by time-lapse videomicroscopy in the conditions ascertaining their basal motility (70% confluence). Cells were analyzed in the control (serum-free) conditions (upper left), in the presence of DU-145 cells (upper right), in the presence of DU-145 cells and 25 μM FF (lower left), or in the presence of DU-145 cells, 25 μM FF and 10 μM GW9662 (lower right). Cell trajectories are depicted as circular diagrams (axis scale in µm) drawn with the initial point of each trajectory placed at the origin of the plot (registered for 7 h; n > 50). Inserts depict cell morphology visualized by IMC. Dot-plots and column chart show movement parameters of proximal cells at the single cell and population level, respectively. Statistical significance was estimated with the non-parametric Mann-Whitney test. Error bars represent SEM. Scale bar: 25 µm. Note that increased sizes and numbers of vinculin(+) FAs in FF-treated HUVECs correlate with their attenuated motility. GW9662 counteracts the effects of FF on HUVEC cytoskeleton but not on their motility. All results are representative of three independent experiments.
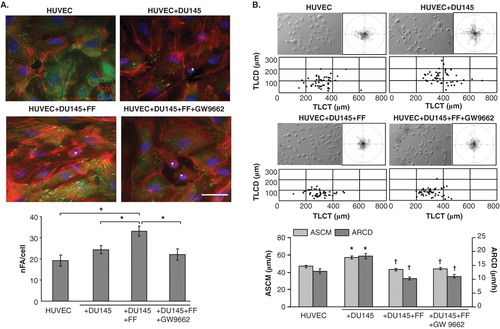
Figure 3. Fenofibrate induces ROS production in HUVECs co-cultured with DU-145 cells in a PPARα – dependent manner. DU-145 cells were seeded onto the monolayer (98% of confluence; serum-free) of HUVECs at the density of 1300 cells/cm2 in the absence (upper right), in the presence of 25 μM FF (lower left), or in the presence of 25 μM FF and 10 μM GW9662 (lower right). Co-cultures were incubated in the presence of DHR123 (2 μM) for 4 h and analyzed with FACSCalibur flow cytometer. DHR123-specific signal was collected in green channel (505 nm – 560 nm). Dot-plots comprise 20,000 events gated according to SSD properties Inserts show data quantification according to the gates indicated in the plots. All results are representative of three independent experiments.
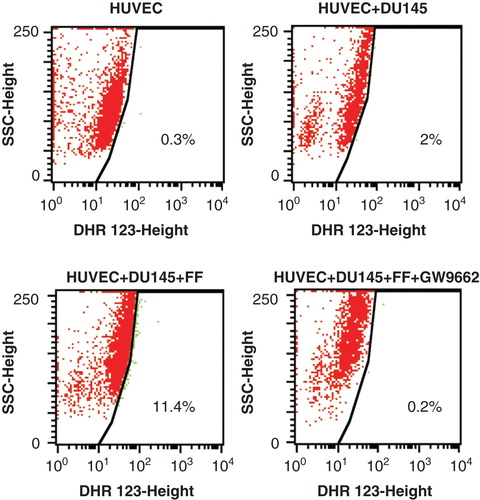
Figure 4. Communication networks within the metastatic niche do not participate in augmentation of HUVEC barrier function by fenofibrate. A. Calcein-loaded DU-145 cells were seeded onto HUVEC monolayers (98% of confluence) in the absence (upper left), in the presence of 25 μM FF (upper right) or in the presence of FF and GW9662 (lower left). The inhibitory effect of FF on GJIC in HUVEC/DU-145 co-cultures is illustrated by quantification of calcein transfer assay (coupling index, Ci, lower right; 2 h). Statistical significance versus the relevant control at p < 0.01 (t-Student test, n = 3). Scale bar: 25 µm. B. The effect of siRNA Cx43 silencing in DU-145 cells and AGA (100 μM) on EPI and HUVEC motility was compared (see legend to and ). Statistical significance was estimated with the non-parametric Mann-Whitney test (* vs HUVEC control; † vs HUVEC+DU-145; p ≤ 0.01). Error bars represent SEM. C. HUVECs were cultured in control conditions (98% of confluence), in the presence of DU-145 cells, and in the presence of DU-145 cells and 25 μM FF for 24 h. Then, expression of angioactive proteins was estimated by semiquantitive technique based on antibody array kit (see Methods). Plots show the densitometrically estimated dot intensities illustrating the protein amounts in HUVEC/DU-145 co-cultures in the absence and in the presence of 25 μM FF relative to HUVEC control. Note that FF had minute effect on the expression pattern of angiogenic factors in the co-cultures. D. HUVEC/DU-145 co-cultures were established as in C, and pSer473Akt and pThr202/pTyr204 ERK1/2 levels were visualized by immunoblotting at the indicated time points in the absence and presence of 25 μM FF. Numerical values represent results of densitometric analyses, normalized against housekeeping gene expression (α-tubulin) and FBS control and compared to control (HUVEC = 1). Note the increase of ERK1/2 and Akt phosphorylation in HUVECs in co-cultures with DU-145, and of Akt phosphorylation in the presence of 25 μM FF, respectively. Results are representative of three independent experiments.
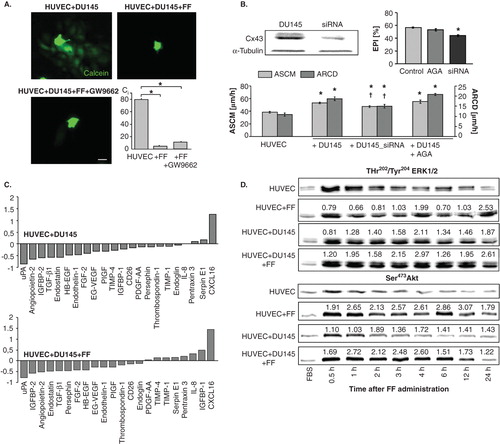
Figure 5. Fenofibrate directly targets endothelial cell cytoskeleton and motility. A. HUVECs were cultivated in the absence or in the presence of 25 μM FF. Tyr397FAK levels and vinculin expression at protein and mRNA level were analyzed at the indicated time points by immunoblotting and qRT-PCR (quantified as described in Figure 4D). B. Cytoskeletal architecture of HUVECs cultured in control conditions (upper left), in the presence of 25 μM FF (upper right), or in the presence of 25 μM FF + 10 μM GW9662 (lower left) was visualized and the numbers of FAs per single cell quantified as in Figure 2 (lower right). C. HUVECs (98% of confluence) were cultivated in the in the presence of 25 μM FF (upper plot), or in the presence of 25 μM FF and 10 μM GW9662 (lower plot). Cells were incubated in the presence of DHR123 (2 μM) for 4 h and analyzed with FACSCalibur flow cytometer as in . D. HUVEC motility in the control conditions (70% of confluence; left), in the presence of 25 μM FF (middle left) 25 μM FF + 10 μM GW9662 (middle right) was visualized by time-lapse videomicroscopy and analyzed as in Figure 2B (right). Statistical significance was estimated with the non-parametric Mann-Whitney test (* vs HUVEC control; p ≤ 0.01). Error bars represent SEM. Results are representative of three independent experiments.
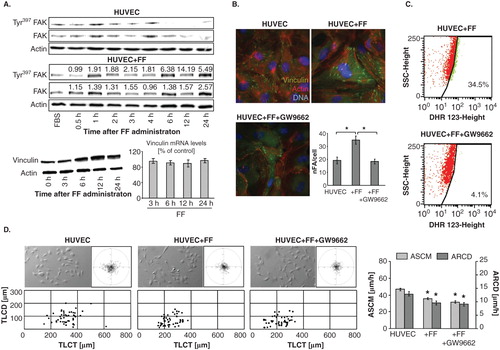
Figure 6. PPARα-independent signaling is involved in the augmentation of endothelial barrier function by fenofibrate. A. Cytoskeletal architecture of HUVECs cultured in control conditions (left), in the presence of 25 μM FF (middle left), 25 μM FF + 5 mM NAC (middle right) is visualized and the numbers of FAs per single cell quantified as in Figure 2 (right). Statistical significance versus the relevant control at p < 0.01 (t-Student test, n = 3). B. HUVEC motility in the control conditions (70% of confluence), in the presence of 25 μM FF and 25 μM FF + 5 mM NAC was visualized by time-lapse videomicroscopy and analyzed as in Figure 2B. Statistical significance versus the relevant control at p < 0.01 (t-Student test, n = 3). C. HUVEC monolayers (98% of confluence) treated with 25 μM FF (left), or with 25 μM FF and 5 mM NAC (right) were incubated in the presence of DHR123 and analyzed with FACSCalibur flow-cytometer as in Figure 3. Note that NAC abrogates HUVEC reactions to FF but does not down-regulate intracellular ROS levels.
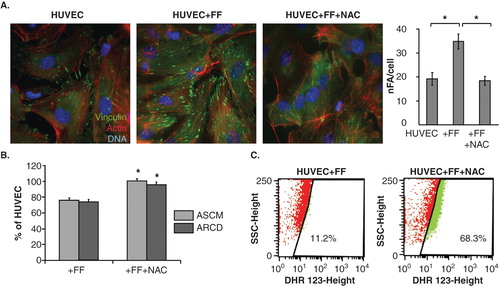
Figure 7. FF does not exert sub-lethal effects in HUVECs. A. Functional status of ZO-1-mediated intercellular contacts in control conditions (upper left), in the presence of 25 μM FF (upper right), or in the presence of 25 μM FF + 10 μM GW9662 (lower left); and the effect of DU-145 and 25 μM FF on solute permeability of HUVEC monolayers was analyzed as described (see Figure 1 and Methods, respectively). B. HUVECs were cultured in control conditions (98% of confluence) and in the presence of 25 μM FF for 24 h. Then, angioactive proteins were analyzed as in . C. HUVECs were cultivated in the presence of FF (25-100 μM) and their cytoskeleton architecture (see Figure 6A for control; upper panel) motility (middle), and viability (lower plot) was quantified. Statistical significance: * versus the relevant control at p < 0.01, using the Wilcoxon signed-rank test (A), Mann–Whitney (B) and Student t-test (C). Note the dose-dependent effects of FF on HUVEC cytoskeleton and motility but not on HUVEC viability.
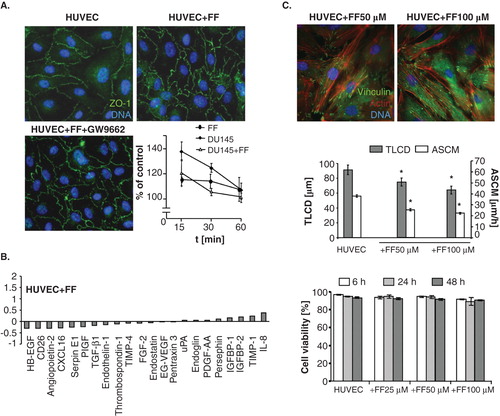
Table 1. Effect of fenofibrate on the motile activity of HUVECs.