Figures & data
Box 1. Drug summary.
Table 1. Pharmacokinetic parameters in 10 human patients receiving idursulfase (0.5 mg/kg weekly as a 3-hour infusion).
Figure 1. Treatment efficacy in the Phase II/III clinical trial for change in 6MWT distance and change in %FVC from baseline (components of the primary composite endpoint score).
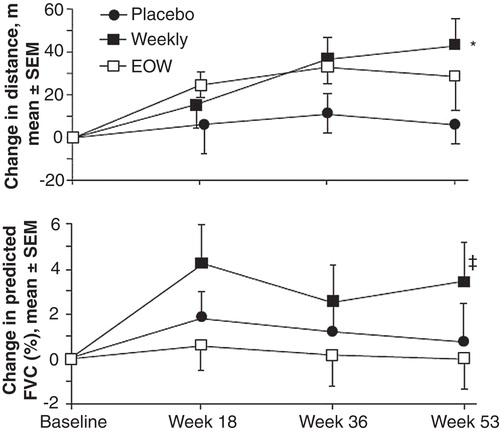
Figure 2. A. The effect of idursulfase on %FVC. Baseline %FVC = 56.2% ± 1.5% (mean ± SE). **p < 0.01. B. The effect of idursulfase on absolute FVC (p < 0.001 compared with baseline for each value of the total population). No statistical testing was performed on the subgroups. Baseline FVC was 1.18 ± 0.055 L (mean ± SE) for the total population.
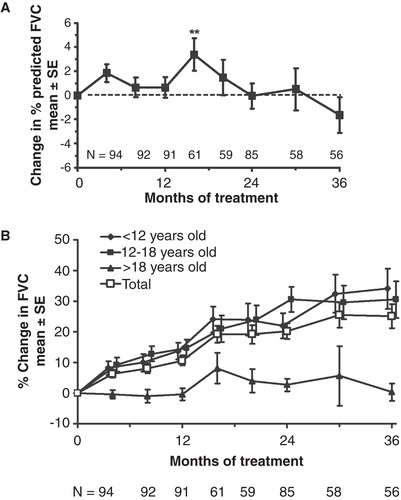
Figure 3. Effect of idursulfase on 6MWT distance in the Phase II/III extension study. Baseline 6MWT distance = 400 ± 10 m (mean ± SE). The dotted horizontal line represents the baseline.
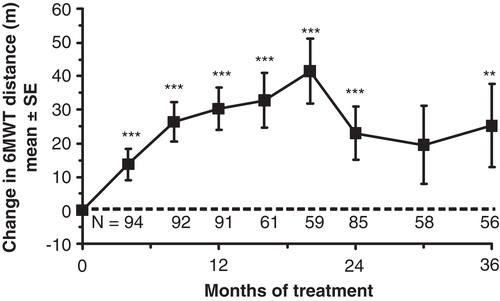
Figure 4. Growth charts for MPS II patients A. under 10 years of age at the start of enzyme replacement therapy (ERT) with idursulfase and B. 10 years of age or older at the start of ERT. The dotted lines illustrate the growth before ERT and the continuous lines the growth on ERT. The shaded area represents the 3rd to the 97th percentiles of height in boys based on United States Centers for Disease Control and Prevention growth charts. With kind permission from Springer Science+Business Media: Citation[38].
![Figure 4. Growth charts for MPS II patients A. under 10 years of age at the start of enzyme replacement therapy (ERT) with idursulfase and B. 10 years of age or older at the start of ERT. The dotted lines illustrate the growth before ERT and the continuous lines the growth on ERT. The shaded area represents the 3rd to the 97th percentiles of height in boys based on United States Centers for Disease Control and Prevention growth charts. With kind permission from Springer Science+Business Media: Citation[38].](/cms/asset/e3c53e8a-58d2-4e3f-9944-9e5166a2688f/ieod_a_738182_f0004_b.jpg)
Table 2. Summary of safety data in the Phase I/II, Phase II/III, and Phase II/III extension studies, and the HOS under 6 year analysis.