Figures & data
Figure 1. Drugs in active development for rare diseases.
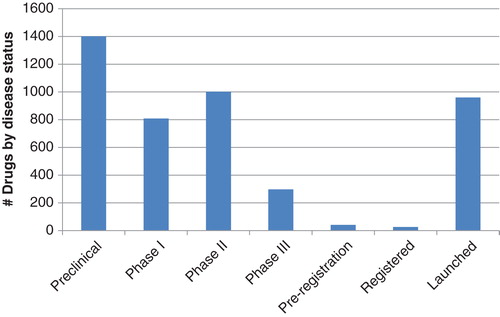
Figure 2. Rare disease drugs in development by therapeutic area. The left ordinate illustrates the numbers of diseases in a therapeutic area; the right ordinate illustrates the numbers of drugs in development.
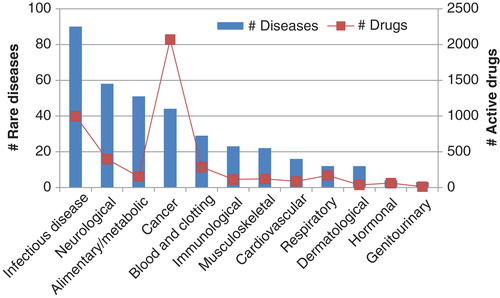
Figure 3. Infectious diseases rare drug development. The ordinate indicates the count of drugs in active development for each disease.
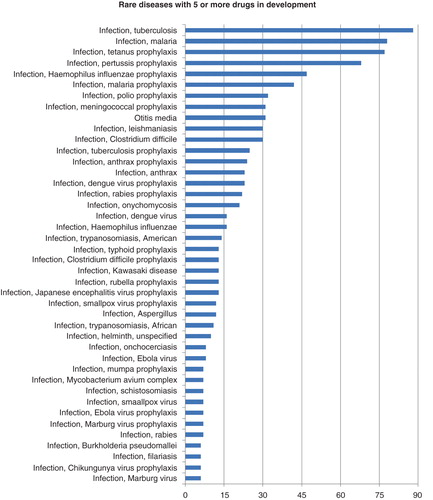
Figure 4. Drugs in active development for rare cancer indications. The abscissa indicates the count of drugs by disease.
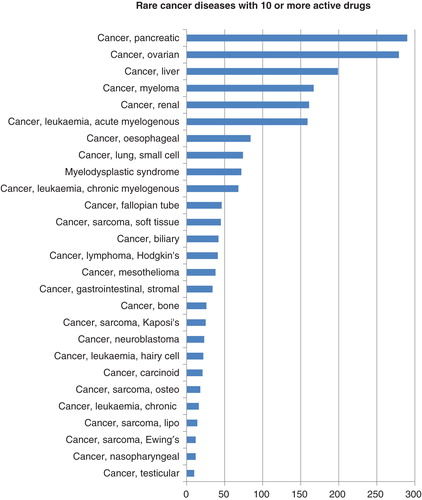
Figure 5. Top 15 originator companies developing drugs for ovarian cancer. For each company, a count of drugs by development phase is indicated on the ordinate.
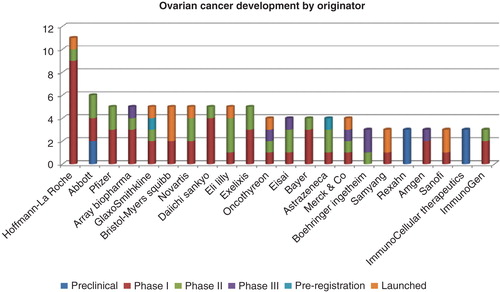
Figure 6. Top 15 originator companies developing drugs for pancreatic cancer. For each company, a count of drugs by development phase is indicated on the ordinate.
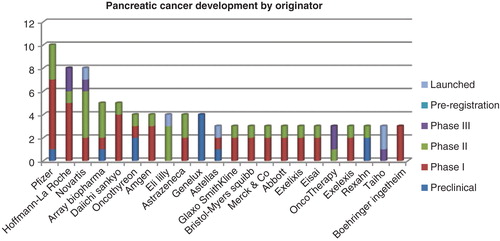
Figure 7. The most novel drugs that are in development for the most rare diseases. For each drug candidate, a count of rare diseases in active development is found on the ordinate.
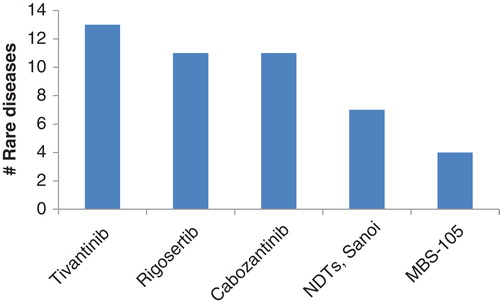
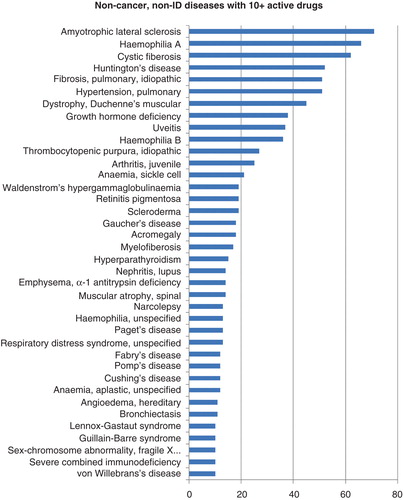
Figure 8. Non-cancer, non-infectious rare diseases with 10 or more drugs in active development.