Figures & data
Figure 1. PRF’s original mission included cause, treatments and cure for Progeria. Cause is achieved, and now the mission is focused on treatments and cure. Multipronged collaborations, all keenly focused on the mission, are key to success.
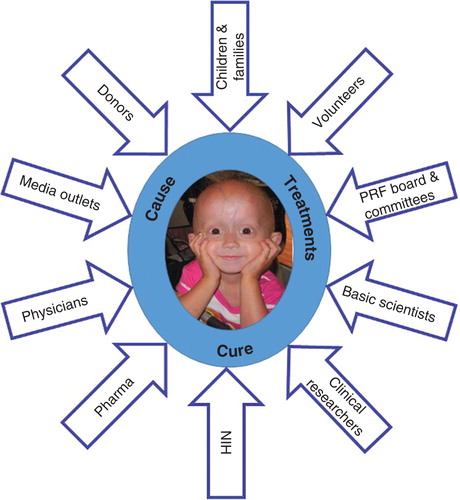
Figure 2. Landmark accomplishments since PRF’s inception. A. A single base substitution optimizes an internal splice site within exon 11 of the LMNA gene, and produces a 150 base pair (red oval) and hence 50 amino acid deletion in the protein product, called progerin; B. A 2000% increase in scientific publications; C. The 2007 PRF Newsletter cover announcing the first-ever Progeria clinical trial; D. Pin map showing a 300% increase in identified children.
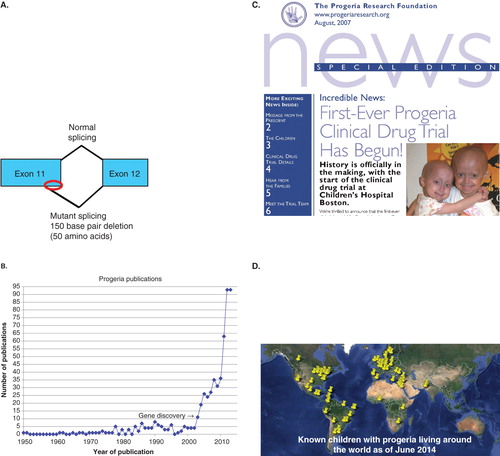
Figure 3. The PRF programs flow chart, demonstrating integration toward treatment discovery.
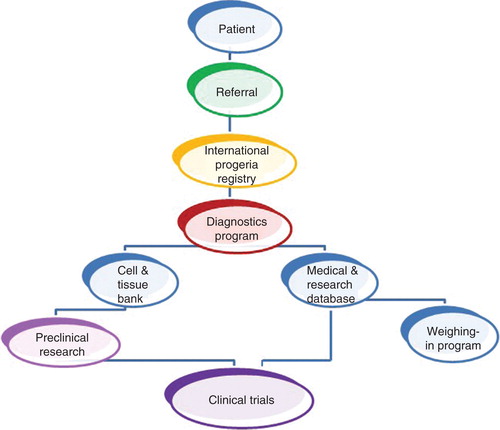
Figure 4. PRF Cell and Tissue Bank has contributed to studies showing the presence of progerin in normal aging skin and normal aging vasculature. A. Red stain detects progerin in cells of a skin biopsy from a 90-year old; B. Progerin detection in three layers of the vascular wall increases with age.
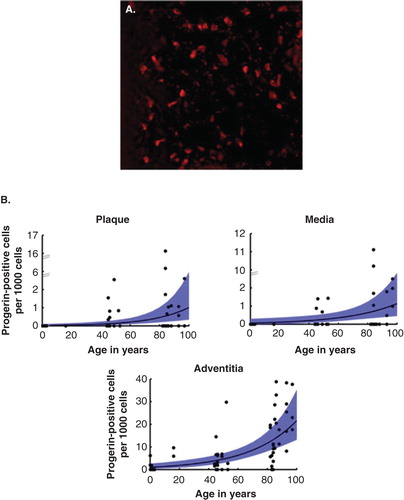
Figure 5. The Progeria clinical handbook is a 100-page healthcare guide for families and caretakers of children with Progeria.
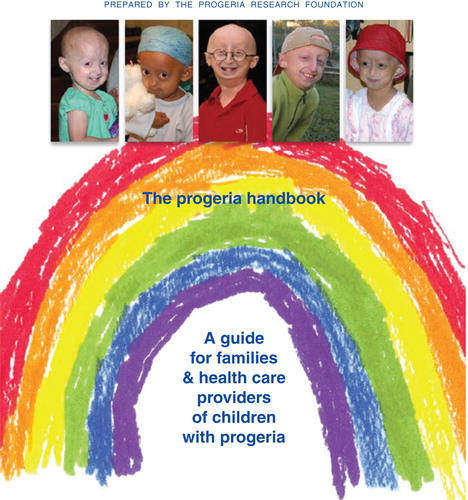
Figure 6. Results showing influence of FTIs on children with Progeria. A. Vascular pulse wave velocity, a measure of vascular stiffness, decreased with treatment (Gordon et al, PNAS, 2012). Each circle represents the PWV of one subject at trial initiation, and is connected to the PWV of that patient after 2 years of treatment. Blue horizontal bar indicates PWV for normal age-matched population. B. Probability of survival increased with treatment (Gordon et al, Circulation, 2014, reproduced with permission). With Kaplan–Meier survival estimates comparing untreated (solid line) to treated (dashed line) cohorts using matched analysis (unadjusted p < 0.001) where Time 0 on the x-axis (i.e., beginning of patient follow-up) is defined as patient birth and subject becomes at risk at the age of treatment initiation for the treated patient in the matched pair.
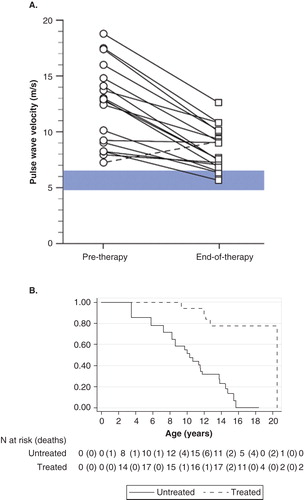
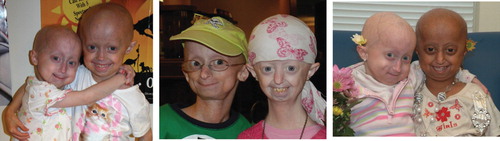
Figure 7. Children come to clinical trials in pairs for crucial emotional support.