Figures & data
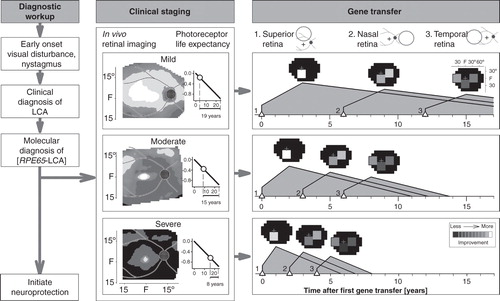
Figure 1. RPE65 and the retinoid cycle. Schematic of a retinal pigment epithelial (RPE) cell and a photoreceptor cell outer segment with the flow of retinoids within and between the two different cells. There are intracellular and extracellular retinoid-binding proteins (such as CRALBP, CRBP1, IRBP). The retinoid isomerase, RPE65 (top center of the figure), the retinoid isomerase, is deficient in a form of LCA. See text for more details.
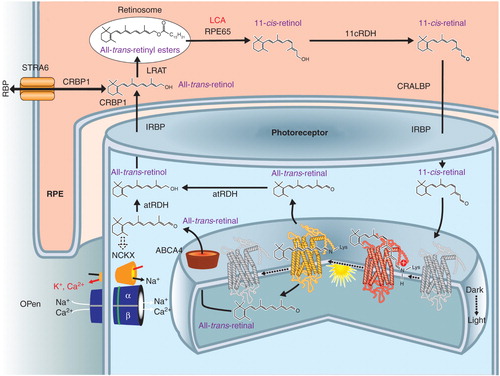
Figure 2. Preclinical studies showing improvement in retinal function in Rpe65-mutant mice treated with oral 9-cis-retinoids (A) or subretinal gene delivery of AAV2-Rpe65 (B). Left: Dark-adapted electroretinograms (ERGs) to increasing stimulus light intensity for a representative wild-type mouse. (A) ERG recordings in a representative 2-month-old Rpe65−/− mouse and in a 2.1-month-old Rpe65−/− mouse 48 h after oral 9-cis-retinal treatment. The treatment causes a lower stimulus threshold and larger amplitude ERGs. (B) ERG recordings comparing the untreated eye of a 2.9-month-old Rpe65rd12 mouse and the contralateral eye treated with subretinal gene therapy. The treatment effect was a lowering of threshold and larger amplitude ERGs.
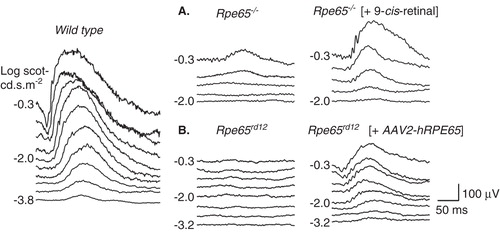
Figure 3. Comparison of early efficacy post-treatment in subretinal gene therapy (A) and oral cis-retinoids (B) in RPE65-LCA. Pseudo-three-dimensional representation of fully dark-adapted sensitivities across the visual field of the (A) gene-treated eye of two patients at baseline and 30 days post-treatment. P9 had a single subretinal injection in the superior retina; P11 had two subretinal injections, one in the superior retina and another in the nasal retina. (B) Baseline and 5 – 6 days after beginning a week-long course of oral cis-retinoids in one eye of two patients. Part B is reproduced with permission from Citation[52].
![Figure 3. Comparison of early efficacy post-treatment in subretinal gene therapy (A) and oral cis-retinoids (B) in RPE65-LCA. Pseudo-three-dimensional representation of fully dark-adapted sensitivities across the visual field of the (A) gene-treated eye of two patients at baseline and 30 days post-treatment. P9 had a single subretinal injection in the superior retina; P11 had two subretinal injections, one in the superior retina and another in the nasal retina. (B) Baseline and 5 – 6 days after beginning a week-long course of oral cis-retinoids in one eye of two patients. Part B is reproduced with permission from Citation[52].](/cms/asset/17d8f19d-20e4-4f88-a275-c13a3fa64e03/ieod_a_1030393_f0003_c.jpg)
Figure 4. An algorithm for gene therapy in RPE65-LCA. Diagnostic workup is followed by clinical staging for severity of retinal degeneration. Photoreceptor life expectancy from time of initial mapping can then be calculated using the delayed exponential model of the disease. Simple or more complex strategies can then proceed with targeting of specific regions of retina proven to have photoreceptor integrity. Neuroprotection can be initiated as early as the diagnosis is made. See text for more details.