Figures & data
Figure 1. A cauliflower plant as an example for a naturally occurring fractal structure. A self-similar pattern across different magnification scales (A–C) is visible in the ramification pattern as well as in the surface structure. When trying to measure the surface, we will recognize an astonishing phenomenon: with increasing zoom factor (A–C), we will detect more and more structural details and surface infoldings, which will result in an increase of the surface.
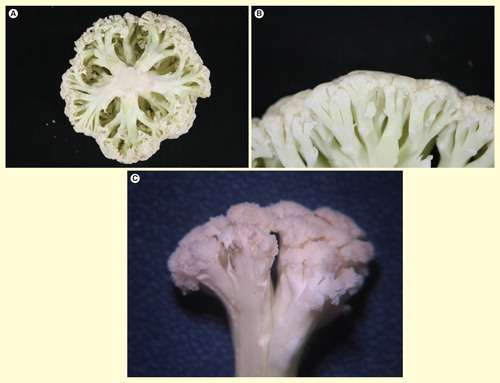
Figure 2. Schematic representation of the fractal globule model after crumpled folding. Open (transcriptionally active) chromatin drawn in white and closed (silent) chromatin in black symbolizing darker heterochromatin and lighter euchromatin in stained nuclei.
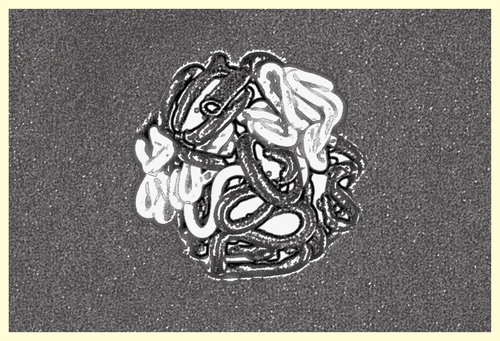
Figure 3. Microscopic image of a H&E-stained cytologic preparation with (segmented) nuclei of a 60 days old Wistar rat.
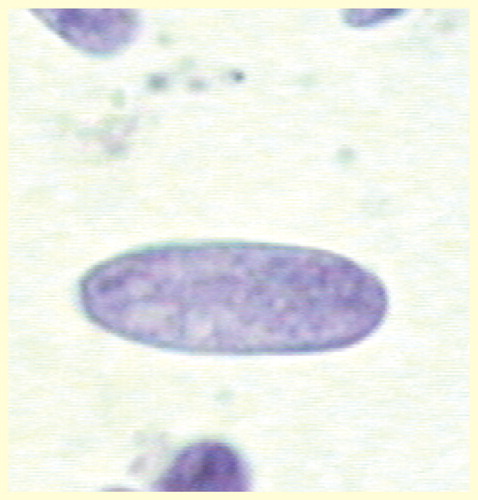
Figure 4. Pseudo-3D representation of . In this image, the inverse gray level (256 gray values) of each pixel represents the height on the z-axis. In that way, white pixels correspond to the bottom and black pixels to maximum height.
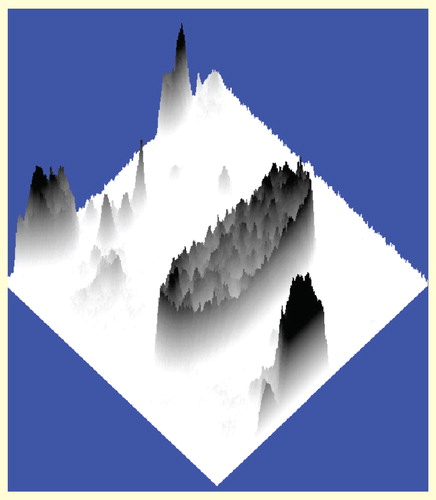
Figure 5. Decreasing fractal dimension of the cardiomyocyte chromatin with increasing age of normal rats in H&E-stained cytologic preparations. X-axis shows age in days after conception.
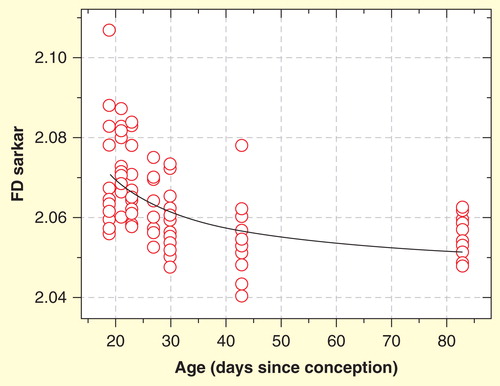
Table 1. Fractal changes of chromatin during carcinogenesis and tumor progression .
Figure 6. Regression plot of the fractal determination in a blast nucleus of a patient with acute precursor B lymphoblastic leukemia. The y values of the measured values (diamonds) are rather close to those of the calculated (ideal) regression curve. The goodness-of-fit (R2 = 0.976) shows that the observed structure approximates an ideal fractal. Scaling window: 200 nm–6.000 nm.
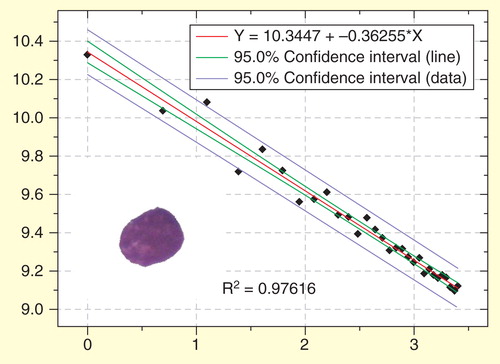
Figure 7. Regression plot of the fractal determination in a blast nucleus of another patient with acute precursor B lymphoblastic leukemia. In this case the y values of the measured values (diamonds) are more distant to the calculated (ideal) regression curve. The goodness-of-fit (R2 = 0.9395) shows that the observed structure is more distant to an ideal fractal than in . Scaling window: 200 nm–6.000 nm.
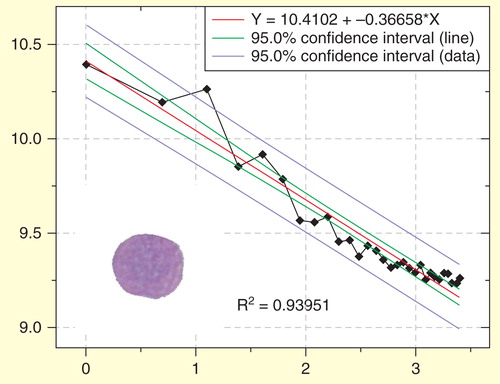
Figure 8. Estimation of the fractal dimension of a myeloma cell nucleus. (A) Myeloma cell nucleus after segmentation (left) and its pseudo 3D transformation (right). (B) The log-log-plot (also called log-log plot or log-log graph ) for the determination of the fractal dimension (FD) is estimated from the slope of the ideal regression line (black) obtained by curve fitting. X-axis shows the logarithms of the inverse values of the size of the structuring element and y axis the logarithmic values of the fractal areas. The fractal dimension (FD) is derived from the slope of the regression line.
Scaling window: 200 nm–6.000 nm.
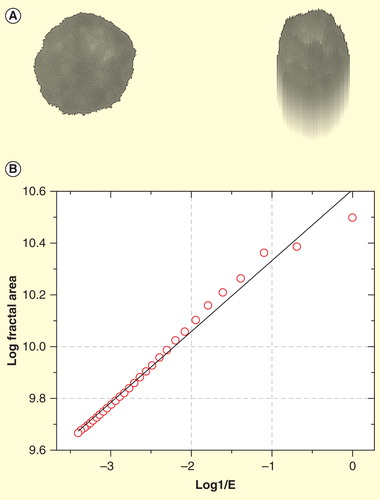
Figure 9. Kaplan–Meier survival plot of patients with multiple myeloma. Shorter survival for patients with higher values of the fractal dimension of nuclear chromatin in routinely stained bone marrow smears.
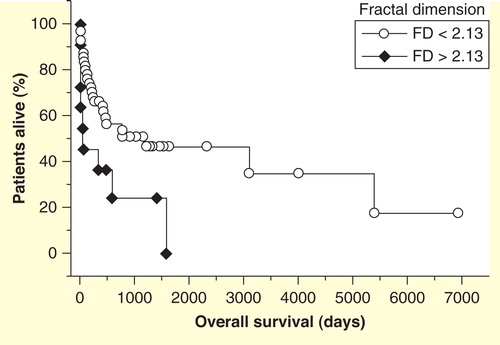
Table 2. Fractal parameters of chromatin as prognostic factors in malignant neoplasias.