3,625
Views
102
CrossRef citations to date
0
Altmetric
Theme: Biomarker Diagnostics - Reviews

Mass spectrometric protein maps for biomarker discovery and clinical research

, , &
Pages 811-825 | Published online: 09 Jan 2014

Figures & data

Figure 1. The MS instrumental principles of shotgun proteomics, selected reaction monitoring and SWATH MS analysis. (A) The purpose of shotgun proteomics is the generation of fragment ion spectra for the identification of the amino acid sequence of peptides. The first analyzer (MS1) is set to scan all the precursor ions at a time and then to select one specific precursor (based on the intensity) for fragmentation. The selected ion undergoes collision-induced dissociation in the collision cell, and the resulting fragments are analyzed by the second analyzer (MS2). The process is repeated for different precursors, yielding the MS2 spectra (shown on the far right). (B) In SRM, precursor ions of a specific peptide are selected in MS1. After fragmentation step, a specific fragment ion from the target peptide (transition) is selected in Q3 and guided to the detector. Finally, an SRM trace corresponding to the specific fragment(s) of the peptide monitored over time is generated. (C) SWATH-MS is a data-independent acquisition method in which the MS2 spectra generation is not guided by the real-time intensity of precursor ions. Here, the MS2 data are acquired by repeatedly cycling through 32 consecutive 25 Da precursor isolation windows (swaths) and monitoring all fragment ions. The high resolution of MS2 spectra (10 p.p.m) ensures the specificity of peptide identification.
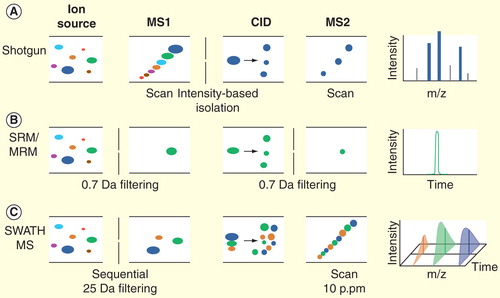
Figure 1. The MS instrumental principles of shotgun proteomics, selected reaction monitoring and SWATH MS analysis. (A) The purpose of shotgun proteomics is the generation of fragment ion spectra for the identification of the amino acid sequence of peptides. The first analyzer (MS1) is set to scan all the precursor ions at a time and then to select one specific precursor (based on the intensity) for fragmentation. The selected ion undergoes collision-induced dissociation in the collision cell, and the resulting fragments are analyzed by the second analyzer (MS2). The process is repeated for different precursors, yielding the MS2 spectra (shown on the far right). (B) In SRM, precursor ions of a specific peptide are selected in MS1. After fragmentation step, a specific fragment ion from the target peptide (transition) is selected in Q3 and guided to the detector. Finally, an SRM trace corresponding to the specific fragment(s) of the peptide monitored over time is generated. (C) SWATH-MS is a data-independent acquisition method in which the MS2 spectra generation is not guided by the real-time intensity of precursor ions. Here, the MS2 data are acquired by repeatedly cycling through 32 consecutive 25 Da precursor isolation windows (swaths) and monitoring all fragment ions. The high resolution of MS2 spectra (10 p.p.m) ensures the specificity of peptide identification.

Figure 2. The generation and targeted navigation of mass spectrometric reference maps associated with specific clinical questions. MS2 spectra are obtained either via the deep-sequencing analysis of the real sample or by the shotgun identification the synthetic peptides representing the proteins of interest. The MS2 information are collected as assays, yielding the mass spectrometric reference maps. The targeted navigation can be then achieved by either SRM-based targeted profiling or SWATH MS-based global profiling. Note that the MS assays from the reference maps are important for both the targeted measurement by SRM and the data extraction step in SWATH analysis.
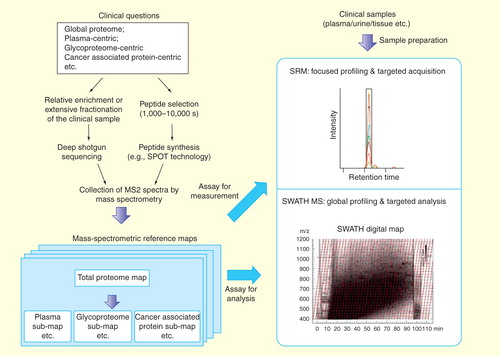
Figure 2. The generation and targeted navigation of mass spectrometric reference maps associated with specific clinical questions. MS2 spectra are obtained either via the deep-sequencing analysis of the real sample or by the shotgun identification the synthetic peptides representing the proteins of interest. The MS2 information are collected as assays, yielding the mass spectrometric reference maps. The targeted navigation can be then achieved by either SRM-based targeted profiling or SWATH MS-based global profiling. Note that the MS assays from the reference maps are important for both the targeted measurement by SRM and the data extraction step in SWATH analysis.

Figure 3. Performance profiles comparing technical advantages and disadvantages of shotgun proteomics, SRM and SWATH MS. In the radar chart, analytical variables are presented on axes staring from the same point and each variable is represented by a spoke. The length of a spoke indicates the magnitude of the variables. Note that SWATH-MS combines the strengths of shotgun and SRM technologies; however, requires more powerful bioinformatic tools for data analysis.

Figure 3. Performance profiles comparing technical advantages and disadvantages of shotgun proteomics, SRM and SWATH MS. In the radar chart, analytical variables are presented on axes staring from the same point and each variable is represented by a spoke. The length of a spoke indicates the magnitude of the variables. Note that SWATH-MS combines the strengths of shotgun and SRM technologies; however, requires more powerful bioinformatic tools for data analysis.

Figure 4. Models of biomarker pipelines for clinical proteomics adapted for different mass spectrometric approaches. The pipelines are based on shotgun proteomics, SRM technique and the availability of SWATH maps. Note the tendency of less dependency on traditional antibody-based methods and more dependency on MS-based techniques along the evolution of the pipeline models.
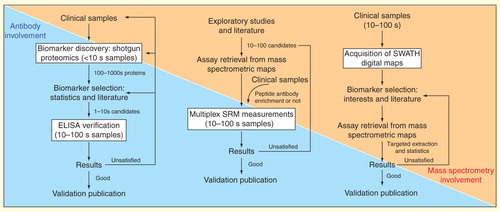
Figure 4. Models of biomarker pipelines for clinical proteomics adapted for different mass spectrometric approaches. The pipelines are based on shotgun proteomics, SRM technique and the availability of SWATH maps. Note the tendency of less dependency on traditional antibody-based methods and more dependency on MS-based techniques along the evolution of the pipeline models.

Figure 5. Comparison of the conventional and the new biomarker pipeline assisted by SWATH maps for human cancer. The upper panel indicates the usage of biomarkers in the longitudinal process such as cancer staging (dysplasia to stage IV). Note that, as illustrated in lower panel, once the SWATH map is acquired, it is a permanent record that allows for iterative in silico interrogation for diagnostic profiles.
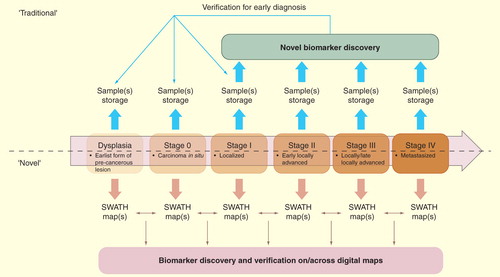
Figure 5. Comparison of the conventional and the new biomarker pipeline assisted by SWATH maps for human cancer. The upper panel indicates the usage of biomarkers in the longitudinal process such as cancer staging (dysplasia to stage IV). Note that, as illustrated in lower panel, once the SWATH map is acquired, it is a permanent record that allows for iterative in silico interrogation for diagnostic profiles.