Figures & data
Figure 1. (A) Overview of RNA and DNA analysis using qPCR and next-generation sequencing for small sample sizes. (B) Experimental setup evaluating the properties of targeted preamplification.
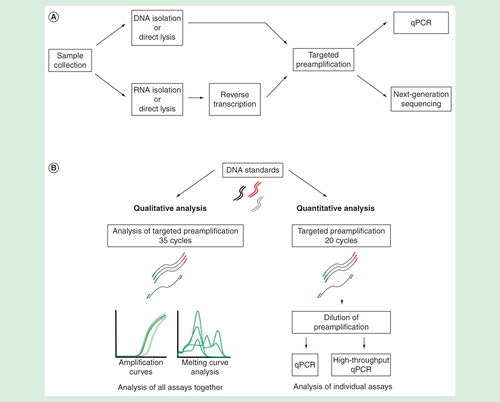
Figure 2. Dynamic range of preamplification – the effect of total template concentration. The preamplification dynamic range with six targets at a constant initial concentration, while increasing the amounts of the other 90 targets. Analysis of preamplification: (A) preamplification response curves and corresponding (B) melting curves at six selected conditions. (C) Average Cq ± SD (n = 3) of the six assays kept at a constant initial template concentration of 100 molecules each per reaction. The linear fit is to guide the eye only. (D) Average Cq ± SD (n = 3) of six randomly selected assays from the preamplification with an initial template concentration of 0 to 107 molecules each. The linear fit is to guide the eye only.
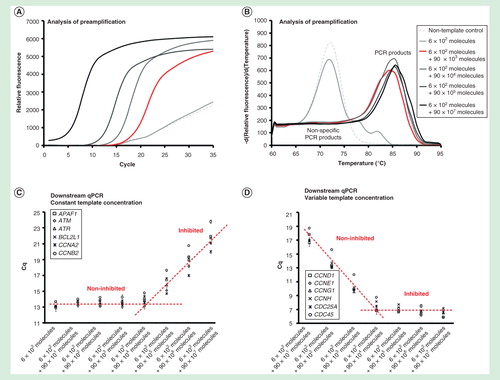
Figure 3. Dynamic range of preamplification – the effect of one target. The preamplification dynamic range of one assay at variable initial target concentration measured in the background of 95 assays with constant target concentrations. Analysis of preamplification: (A) preamplification response curves and corresponding (B) melting curves at six selected conditions. (C) Average Cq ± SD (n = 3) of six randomly selected assays from the preamplification used at a constant initial concentration of 100 molecules each per reaction. The linear fit is to guide the eye only. (D) Average Cq ± SD (n = 3) of the single assay included in the preamplification with an initial template concentration of 102 to 109 molecules. The linear fit is to guide the eye only.
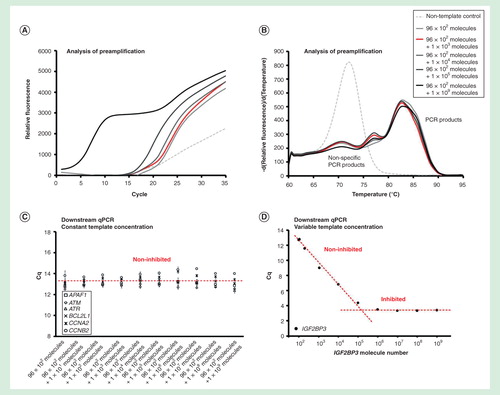
Figure 4. Assay number dependence. The preamplification yield of specific and nonspecific PCR products formed when using 6, 12, 24, 48 and 96 pooled assays. Analysis of preamplification: preamplification response curves and corresponding melting curves for (A, B) positive samples and (C, D) negative controls. Positive samples contained 100 initial molecules of each target. (E) Cq-values (average ± SD) for positive (n = 3) and negative samples (n = 3) using different number of assays in preamplification. (F) High-throughput qPCR data of individual assays. Average Cq ± SD (n = 3) is shown. Data from all preamplified genes were used. (G) Average Cq ± SD (n = 3) of 10 assays included in the preamplification with 12, 24, 48 and 96 pooled assays.
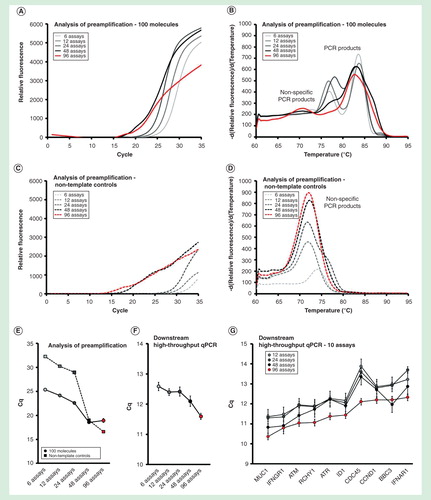
Figure 5. The effect of primer concentration and annealing time. The preamplification yield of specific and nonspecific PCR products formed using different primer concentrations (10, 40, 160 and 240 nM, final individual primer concentrations) and annealing times (0.5, 3 and 8 min). Analysis of preamplification: preamplification response curves and corresponding melting curves for (A, B) positive samples and (C, D) negative controls. Positive samples contained 100 initial molecules of each target. (E) Average Cq ± SD for positive (n = 3) and negative samples (n = 3) using different number of assays in preamplification. (F) High-throughput qPCR data of individual assays. Average Cq ± SD (n = 3) is shown. The right y-axis indicates the percentage of negative controls positive for nonspecific PCR product formation, calculated from the 91 assays performing accurately in the preamplification (ntotal = 273, 3 negative qPCR controls per assay). (G) Average SD of Cq versus average Cq-value for all individual assays.
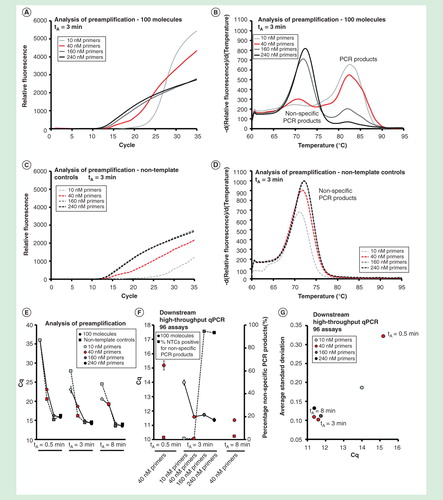
Figure 6. The effect of primer annealing temperature. Preamplification yields of specific and nonspecific PCR products formed as function of the annealing temperature used. Annealing temperatures ranged between 55.0 and 65.3°C. Analysis of preamplification: preamplification curves and corresponding melting curves for (A, B) positive samples and (C, D) negative controls. Positive samples contained 100 initial molecules of each target. (E) Average Cq ± SD for positive (n = 3) and negative samples (n = 3) using different annealing temperatures. (F) High-throughput qPCR data of individual assays. Average Cq ± SD (n = 3) is shown. The right y-axis indicates the percentage of negative controls positive for nonspecific PCR product formation, calculated from the 91 assays performing accurately in the preamplification (ntotal = 273, 3 negative qPCR controls per assay). (G) Average SD of Cq versus average Cq-value for all individual assays.
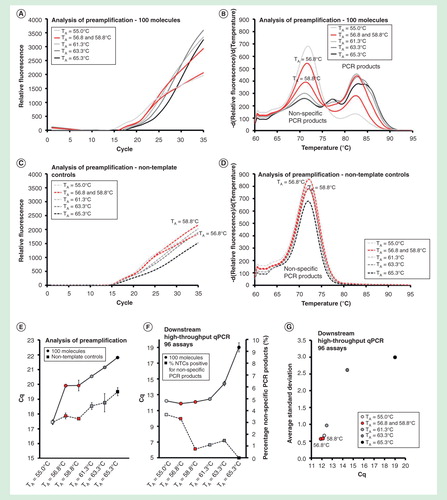
Table 1. Summary of analyzed parameters for targeted preamplification.
Figure 7. The effect of additives on preamplification specificity and efficiency. The yield and specificity of preamplification were evaluated at 35 conditions using 18 different additives. Analysis of preamplification: (A, B) preamplification response curves and corresponding melting curves for reactions in the presence of 1-µg/µl bovine serum albumin with 2.5% glycerol or water. (C) Average Cq ± SD for positive (n = 3) and negative samples (n = 3) applying different conditions for preamplification. ΔCq refers to the difference in Cq-values between positive and negative samples for each condition. Conditions are sorted according to ΔCq-value. (F) High-throughput qPCR data of individual assays for nine selected conditions. Average Cq ± SD (n = 3) is shown. The right y-axis indicates the percentage of negative controls positive for nonspecific PCR product formation, calculated from the 91 assays performing accurately in the preamplification (ntotal = 273, 3 negative qPCR controls per assay).
7-deaza-dGTP: 7-deaza-2′-deoxyguanosine 5′-triphosphate lithium salt; BSA: Bovine serum albumin; DMSO: Dimethyl sulfoxide; DTT: Dithiothreitol; LPA: GenElute-LPA; NTC: Non-template control; Poly(I:C): Polyinosinic–polycytidylic acid potassium salt; TMA Cl: Tetramethylammonium chloride.
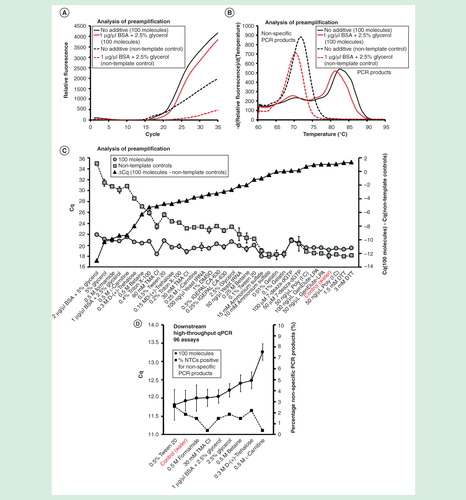
Table 2. Summary of analyzed PCR additives applied for targeted cDNA preamplification.
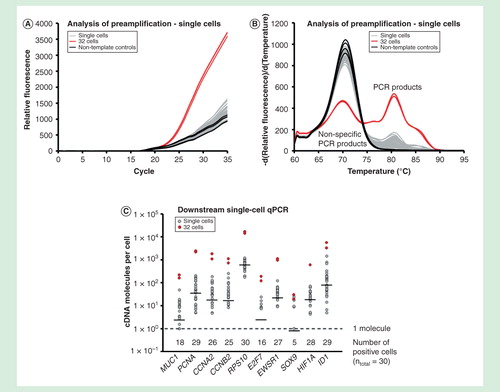
Figure 8. Single-cell analysis. Gene expression profiling of 30 individual MCF-7 cells using targeted preamplification. Analysis of preamplification: (A) preamplification curves and corresponding (B) melting curves for reactions in the presence of 1 µg/µl bovine serum albumin and 2.5% glycerol. (C) Dot plots displaying the expression pattern of 10 selected genes.