Figures & data
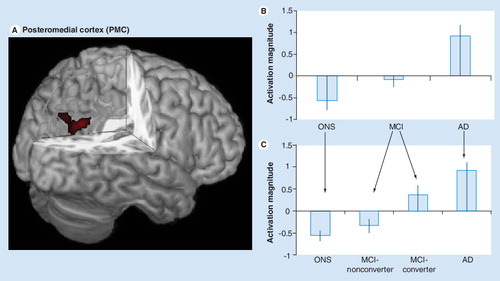
Figure 1. (A) The functional region of interest in the posteromedial cortex (PMC) used in our studies is shown in red and overlaid on a 3D canonical T1-weighted brain template image with posterior cortex cutout. (B) Activation magnitude parameter estimate (with standard error bars) in the PMC region (A). In this region, parameter estimates for activation magnitude demonstrated a lesser-to-greater activation from control (ONS), to MCI to AD subjects. (C) Activation magnitude parameter estimate (with standard error bars) in the PMC region (A), demonstrating a continuum from control (ONS), to MCI-nonconverter, to MCI-converter to AD. There were statistically significant (p < 0.05) differences between all groups with the exception of the control and MCI-nonconverter group, and the AD and MCI-converter group. An overall pattern of negative activation magnitude in the control and MCI-nonconverter groups and positive activation magnitude in the AD and MCI-converter groups is evident.
AD: Alzheimer’s disease; MCI: Mild cognitive impairment; ONS: Older normal subject.
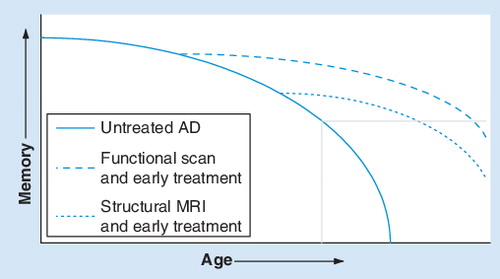
The unbroken line represents the untreated natural progression, the dashed line represents earlier treatment based on structural MRI and the dotted line represents earlier treatment based on functional MRI. The gray box in the bottom right corner represents the onset of AD.
Modified with permission from one provided by Dr Gary Small.
AD: Alzheimer’s disease.