Figures & data
Table 1. The neglected tropical diseases.
Table 2. Emerging infectious diseases (as of 2014).
Figure 1. Lymphatic filariasis antigens on the EpiMatrix protein immunogenicity scale. All other factors being equal, the more HLA ligands (i.e., putative T-cell epitopes) contained in a given protein, the more likely that protein is to induce an immune response. To capture this concept, the EpiMatrix immunogenicity scale presents proteins by the EpiMatrix protein score, and compares them to other known immunogens. The EpiMatrix protein score is the difference between the number of predicted T-cell epitopes expected in a protein of a given size and the number of putative epitopes predicted by the EpiMatrix. The EpiMatrix protein scores are ‘normalized’ and can be plotted on a standardized scale. ‘Average’ proteins score near zero. Protein scores above zero indicate the presence of excess MHC ligands and denote a higher potential for immunogenicity, while scores below zero indicate the presence of fewer potential MHC ligands than expected and a lower potential for immunogenicity. The EpiMatrix protein score is correlated with observed immunogenicity in vitro and in vivo. As shown here, proteins scoring above +20, such as Brugia malayi antigen Juv-p120, are considered to have a significant immunogenic potential. Proteins scoring below –20, such as TPX-2 above, are less likely to be immunogenic in vivo.
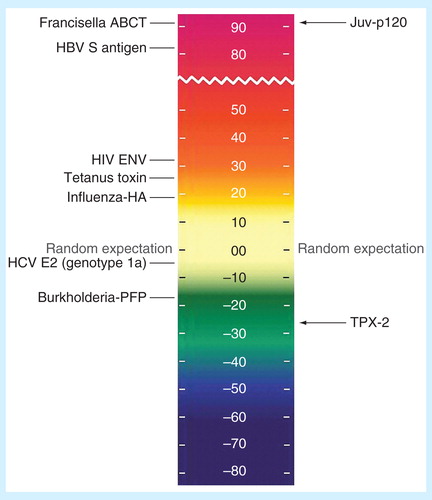
Figure 2. JanusMatrix analysis. This tool considers identity of TCR-facing residues to target proteins or genomes independently from residues that contribute to MHC binding. Peptides that have similar TCR-facing residues and are presented in the context of the same HLA can be identified. Extensive homology is easy to identify using the Cytoscape network visualization tool. The extent of the network can be used to distinguish potential regulatory T-cell epitopes (A) from potential effector T-cell epitopes (B). A published Treg epitope example is shown in (C), and several published Teff epitope examples are shown in (D). For these illustrations, yellow hexagons identify the source antigens, turquoise diamonds identify the source T-cell epitope clusters, gray squares indicate the source 9-mers, dark blue triangles indicate matched human 9-mers and light blue circles indicate human antigens in which matched 9-mers are found.
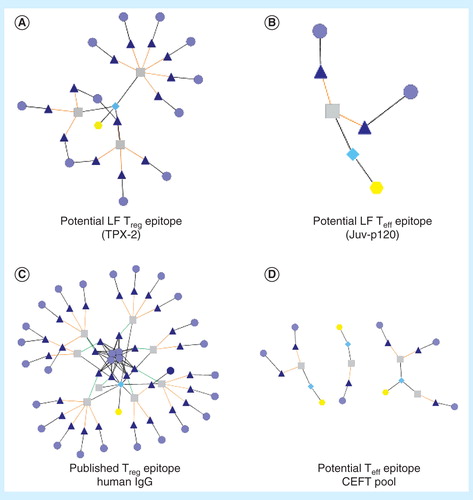
Figure 3. Example of an EpiBar: EpiMatrix analysis of candidate lymphatic filariasis epitope. In addition to providing an overall immunogenicity score, EpiMatrix can be used to analyze epitopes at the local level. A Brugia malayi Juv-p120 peptide is shown above, parsed into 9-mer frames and analyzed for predicted immunogenicity. EpiMatrix assessments above 1.64 constitute the top 5% of predicted HLA binders and are shaded medium blue, while scores above 2.32 fall in the top 1% and are shaded dark blue. This Juv-p120 peptide registers significant scores for all eight alleles in EpiMatrix in a single 9-mer frame, and based on the EpiMatrix method, has a cluster score of 16.81 (reflecting the number of predicted binders per amino acid length). Cluster scores higher than 10 are considered to be significant based on retrospective and prospective studies carried out by the EpiVax group. The band-like pattern illustrated in frame 35 is called an EpiBar and is characteristic of promiscuous epitopes.
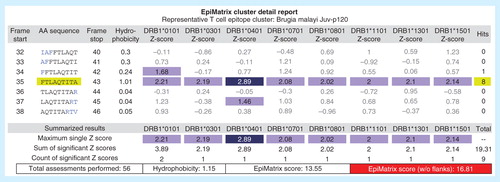
Figure 4. Class I epitope ‘staircase’ ranking. In the process of generating a selection of predicted high-affinity class I epitopes for inclusion in T-cell-driven vaccines, parsed 9-mers from any antigen are ranked by potential to bind supertype HLA alleles and collated in a ‘staircase’ report. In this example, the top five highest-scoring peptides from a given antigen are shown. In general, prioritizing class I epitopes by score for each of the individual alleles is preferred to define epitopes that bind across alleles.
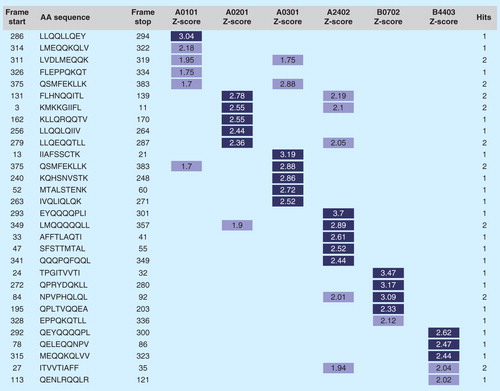
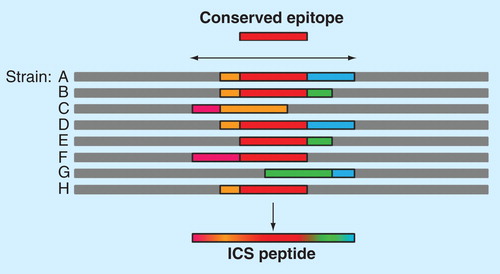
Figure 5. EpiAssembler construction of immunogenic consensus sequences. This figure illustrates the process of assembling highly conserved T-cell epitopes into a single molecule. First, a highly conserved, promiscuous epitope is identified to form the 9-mer core of the ICS peptide (red bar). Overlapping conserved epitopes (pink, orange, green and blue bars) are then added to the N- and C-termini of the peptide until a suitable length is reached for binding in the class II HLA binding groove. This economical approach allows for targeting of multiple strains of a given pathogen using a single peptide, as illustrated by the blended bar at the bottom of the figure.