
Figures & data
Figure 1. Frequently reported post-translational protein modifications.
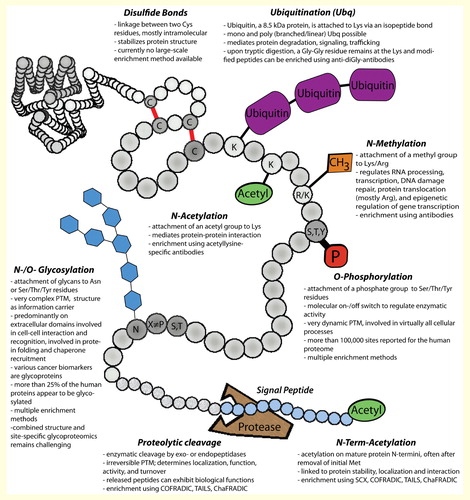
Figure 2. Frequency of human PTMs. Summary of human PTMs which, according to UniProt and PhosphoSitePlus, have been detected (A) frequently, (B) less frequently and (C) rarely. For UniProt, the percentage of entries with experimental evidence is given (ECO:0000269). (D) The high number of known PTMs is in stark contrast to the limited knowledge about their involvement in disease.PTM: Post-translational modification.
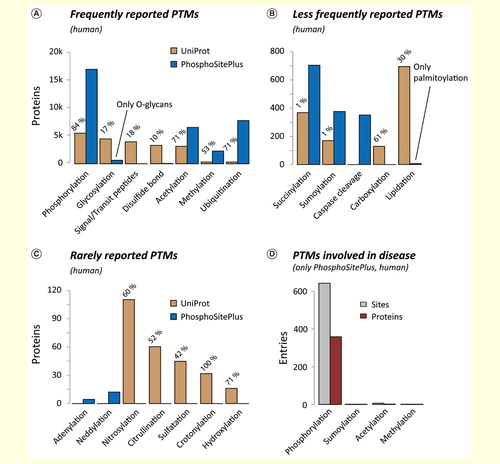
Figure 3. Using the classical t-test for biomarker research. Two simulated markers 1 and 2 (A) in a background of an iTRAQ-based phosphoproteomics experiment (B, C). Using the two-sample t-test, the not-promising marker 2 would be defined as significant, whereas marker 1 would not be considered. Using the moderated t-test provided in the Limma package Citation[92,89,93], only the promising marker 1 remains significant. A detailed description for the use of this package was recently published by Kammers et al. Citation[86].
![Figure 3. Using the classical t-test for biomarker research. Two simulated markers 1 and 2 (A) in a background of an iTRAQ-based phosphoproteomics experiment (B, C). Using the two-sample t-test, the not-promising marker 2 would be defined as significant, whereas marker 1 would not be considered. Using the moderated t-test provided in the Limma package Citation[92,89,93], only the promising marker 1 remains significant. A detailed description for the use of this package was recently published by Kammers et al. Citation[86].](/cms/asset/28a9ee01-02d4-4de7-9ca7-bba1b91ae430/ieru_a_1042867_f0003_oc.jpg)
Figure 4. Protein copy number distribution in HeLa cells Citation[221] and copy numbers of some prominent cancer biomarkers. (*indicates a membrane protein). Dashed lines give the limits of detection when analyzing a certain number of cells, assuming a full quantitative recovery and a limit of detection of 100 amol. If only 600 cells are available, approximately 20% of the proteome will be covered.
![Figure 4. Protein copy number distribution in HeLa cells Citation[221] and copy numbers of some prominent cancer biomarkers. (*indicates a membrane protein). Dashed lines give the limits of detection when analyzing a certain number of cells, assuming a full quantitative recovery and a limit of detection of 100 amol. If only 600 cells are available, approximately 20% of the proteome will be covered.](/cms/asset/c412c433-f5aa-4ac6-b978-b039c6b95bcd/ieru_a_1042867_f0004_ob.jpg)