Figures & data
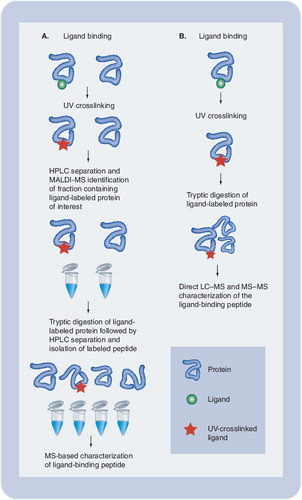
(A)Following interaction of the protein of interest with a photolabeled ligand, the complex is covalently linked by UV irradiation. Isolation of the covalent complex followed by MS allows for identification of binding protein, determination of the ligand:protein stoichiometry, and identification and sequencing of the ligand-binding region of the protein. We used this approach to localize the binding site for an inhibitor of the HIV-1 integrase protein. (B) Alternatively, if the receptor protein is known, the purified protein may be subjected to direct LC-MS following ligand binding, crosslinking and tryptic digestion. This approach may be advantageous when dealing with hydrophobic ligands that may be lost during HPLC separation.
HPLC: High-performance liquid chomatography; LC: Liquid chromatography; MALDI: Matrix-assisted laser desorption/ionization; MS: Mass spectrometry; UV: Ultraviolet.
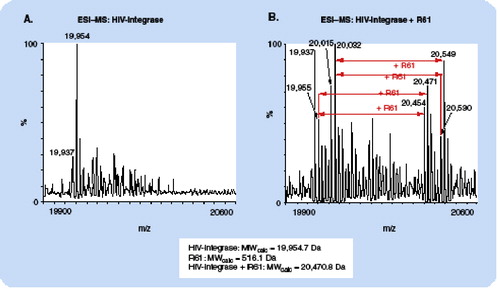
(A): the base peak at m/z 19,954 agrees precisely with the MW of HIV-integrase as calculated from the amino acid sequence. The additional peaks at higher m/z can be assigned to oxidation products and β-mercaptoethanol adducts. (B): due to the presence of the photoaffinity label, the peaks are shifted to higher m/z values by 516 Da, which agrees precisely with the expected mass increment for addition of one coumarin molecule.
ESI: Electrospray ionization; MS: Mass spectrometry; MW: Molecular weight.
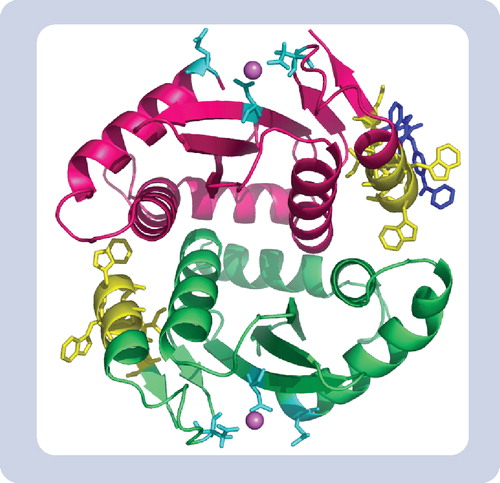
Yellow represents the inhibitor binding region peptide 128AACWWAGIK136. Blue represents one molecule of the coumarin inhibitor complexed within the binding site determined by PAL-MS. Cyan represents the integrase active site residues (DDE motif) and the sphere is Mg2+ chelating at this site.
MS: Mass spectrometry; PAL: Photoaffinity labeling.