Figures & data
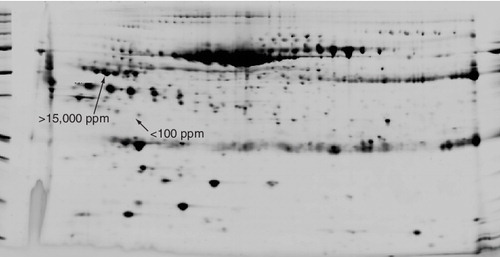
The dynamic range and reproducibility of quantitative 2D gel electrophoresis of human blood serum. More than 1500 protein spots are resolved and quantitated within the 2D gel pattern of human blood serum. Typical quantities, ranging from <100 to >15,000 ppm, are indicated to demonstrate the dynamic range (black arrows).
Disease-specific discrimination was accomplished using both canonical discriminant analysis (top) and linear discriminant analysis (bottom), showing discrimination between patients with AD, PD and ALS (A) and patients with AD, AD-like and normal controls (B).
AD: Alzheimer’s disease; ALS: Amyotrophic lateral sclerosis; PD: Parkinson’s disease. Data from Citation[14,15].
![Figure 2. Differential diagnostics through multivariate biostatistics of blood serum concentrations of groups of proteins using quantitative 2D gel electrophoresis.Disease-specific discrimination was accomplished using both canonical discriminant analysis (top) and linear discriminant analysis (bottom), showing discrimination between patients with AD, PD and ALS (A) and patients with AD, AD-like and normal controls (B).AD: Alzheimer’s disease; ALS: Amyotrophic lateral sclerosis; PD: Parkinson’s disease. Data from Citation[14,15].](/cms/asset/0ad55026-dda3-4249-aa54-f4086edc4bf1/ieru_a_11217009_f0002_b.jpg)
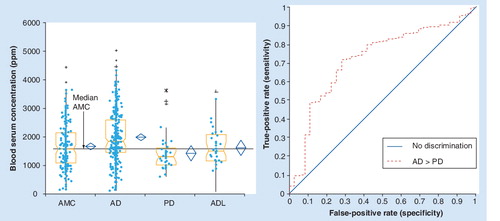
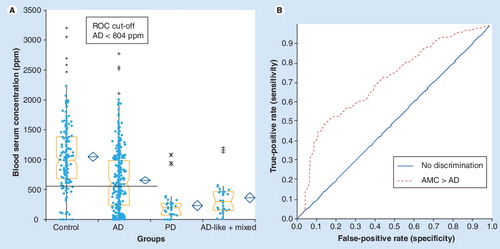
(A) Box and whiskers quantitative level and (B) capability of differentiation between AD and AMC.
AD: Alzheimer’s disease; AMC: Age-matched controls; PD: Parkinson’s disease; ROC: Receiver operator characteristics.
(A) Box and whiskers quantitative level and (B) capability of differentiation between AD and PD.
AD: Alzheimer’s disease; ADL: AD-like and mixed; AMC: Age-matched controls; PD: Parkinson’s disease.