Figures & data
Figure 1. (A) Preoperative 18F-fluorodeoxyglucose (FDG) PET/CT maximum intensity projection and (B) cross sectional fused 18F-FDG PET/CT images of a colorectal cancer patient demonstrating a solitary hypermetabolic focus in the sigmoid colon. (C) Postoperative 18F-FDG PET/CT maximum intensity projection of the lower abdomen and pelvis demonstrates no evidence of hypermetabolism in the region of the previously resected sigmoid mass.
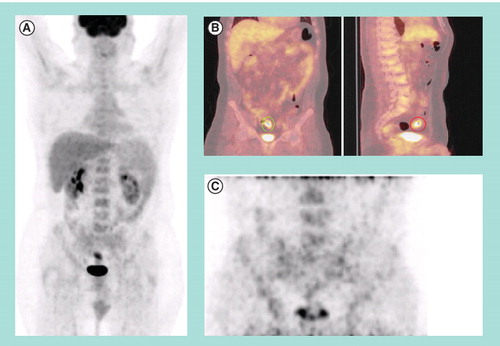
Figure 2. (A) Digital photograph of a resected sigmoid colon specimen with magnified region of interest. Suture placed at suspected tumor site based on intraoperative palpation and γ-probe detection. (B) Fused 18F-fluorodeoxyglucose PET/CT image of the resected sigmoid colon specimen. (C) Micro-PET/CT image of the specimen illustrates intense hypermetabolic activity at the tumor site and with only diffuse tracer uptake in the surrounding normal colon tissue.
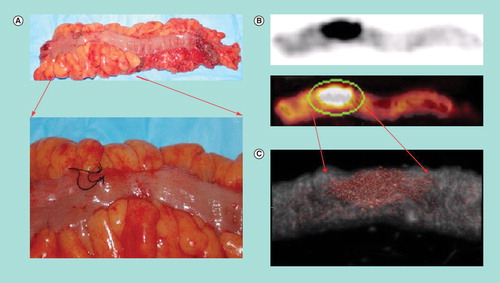
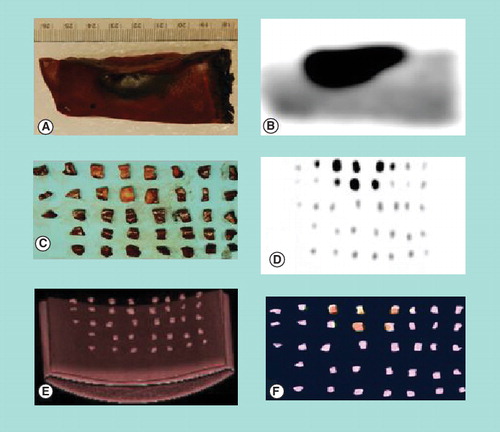
Figure 3. (A) Digital photograph of cut section of a portion of a resected liver tumor after preoperative injection of 18F-fluorodeoxyglucose. (B) Corresponding PET imaging of the same portion of the resected liver tumor, with dark spot representing resected liver tumor and surrounding lighter area representing normal liver tissue. Digital photograph (C), PET image (D), CT image (E) and fused PET/CT image (F) of the same portion of the resected liver tumor after it was divided into multiple small pieces. The metabolic activity quantified in the specimen pieces correlates well with the tumor burden.