
Figures & data
Table 1. Composition of Hizentra®.
Figure 1. Steps in the manufacturing process of Hizentra.
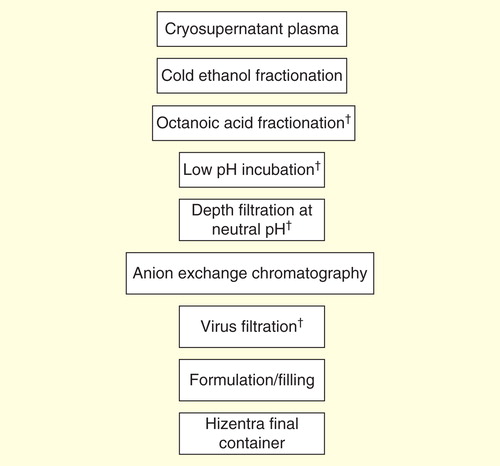
Figure 2. Pharmacokinetic simulation of steady-state concentration profiles for IgG following Hizentra weekly or biweekly dosing or Privigen monthly dosing. Total monthly sc. doses are 1.53-fold higher than iv. doses.
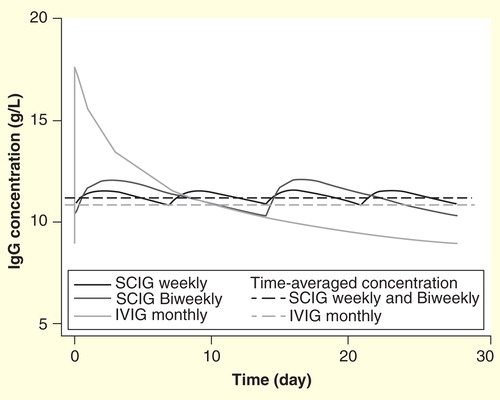
Table 2. Published studies of Hizentra in patients with primary immunodeficiency disease: mean dose, IgG levels and acute serious bacterial infections.
Table 3. Secondary efficacy end points in Hizentra studies.
Table 4. Summary of adverse events and adverse event rates in Hizentra efficacy studies.
Table 5. Summary of related adverse events, excluding local reactions, in >5% of patients in Hizentra primary efficacy studies.