Figures & data
Adapted with permission from Citation[1] © Elsevier.
![Figure 1. Overall histological organization of the digestive tube.Adapted with permission from Citation[1] © Elsevier.](/cms/asset/d9a9e1a0-10ed-4b45-a6e2-45b92365c845/ierd_a_11207343_f0001_b.jpg)
(A) The ultrasonographic five-layer and (B) nine-layer gastrointestinal wall structure. The interface echoes of the ultrasound image will appear continuous with the echo-rich wall layers. By thickening of the Mm and a visible interface echo generated between the inner and outer part of the muscularis propria, up to nine different layers can be separated by ultrasonography.
Mm: Muscularis mucosae.
Reproduced with permission from Citation[56].
![Figure 2. Relationship between histological and ultrasonographic gastrointestinal wall layers.(A) The ultrasonographic five-layer and (B) nine-layer gastrointestinal wall structure. The interface echoes of the ultrasound image will appear continuous with the echo-rich wall layers. By thickening of the Mm and a visible interface echo generated between the inner and outer part of the muscularis propria, up to nine different layers can be separated by ultrasonography.Mm: Muscularis mucosae.Reproduced with permission from Citation[56].](/cms/asset/8f19ee7c-840e-433f-9f63-4ed1071af520/ierd_a_11207343_f0002_b.jpg)
A thickened layer 2 corresponding to the gastric mucosa is seen (arrows). Reproduced with permission from Citation[56].
![Figure 3. A five-layered structure of the gastric wall showing Menetriers disease.A thickened layer 2 corresponding to the gastric mucosa is seen (arrows). Reproduced with permission from Citation[56].](/cms/asset/253c657a-9f98-41ca-b1ec-c4e4d08920d5/ierd_a_11207343_f0003_b.jpg)
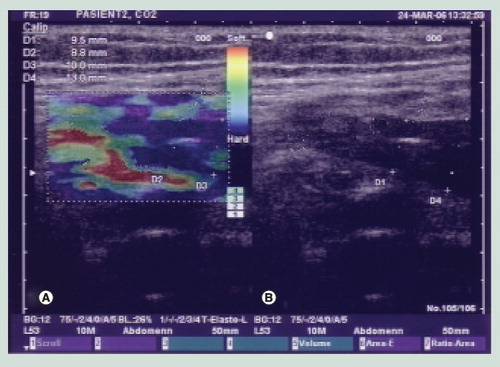
(A) Elastogram in which the blue color indicates a hard and thickened anterior and posterior gastrointestinal wall. (B) Corresponding grayscale ultrasound image.
(A) An ultrasound miniprobe (p) is placed in the relaxed water-filled antral part of the stomach. (B) A contraction with thickening of the mp is seen.
m: Mucosa; mp: Muscularis propria; p: Probe; sm: Submucosa. Reproduced with permission from Citation[56].
![Figure 5. Gastric contraction demonstrated by intraluminal ultrasonography.(A) An ultrasound miniprobe (p) is placed in the relaxed water-filled antral part of the stomach. (B) A contraction with thickening of the mp is seen.m: Mucosa; mp: Muscularis propria; p: Probe; sm: Submucosa. Reproduced with permission from Citation[56].](/cms/asset/3c8fe3d5-c5e5-420e-933b-0428d8bd42fa/ierd_a_11207343_f0005_b.jpg)
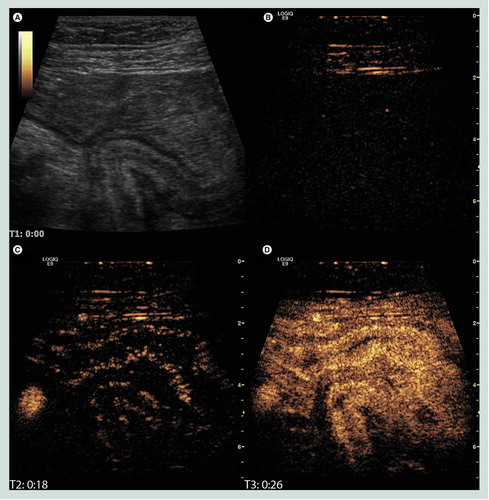
(A) B-mode image of the terminal ileum where a diseased bowel loop has fused causing a sharp turn and an obstruction. (B) The corresponding image in contrast mode at the time of injection showing only interface echoes in the abdominal wall. (C) Just after the arrival of contrast in the right iliac artery and the bowel submucosa. (D) The contrast enhancement has reached maximum intensity. It is not only brighter in the submucosa but also filling the mucosa and proper muscle.
Image courtesy of K Nylund.
Scanning plane a goes through the ultrasound probe and is outside the data set of the tumor. The ultrasound probe is indicated by the arrow.
tu: Inflitrating tumor.
Reproduced with permission from Citation[56].
![Figure 7. 3D ultrasonography of an infiltrating tumor in the cardia is seen in two scanning planes (b and c).Scanning plane a goes through the ultrasound probe and is outside the data set of the tumor. The ultrasound probe is indicated by the arrow.tu: Inflitrating tumor.Reproduced with permission from Citation[56].](/cms/asset/38a074b3-f8c1-43df-b3e5-c3dfb0ec315e/ierd_a_11207343_f0007_b.jpg)
t is seen close to a v. Fine-needle aspiration is performed through the duodenal wall. The echo of the puncture needle is seen (arrow) (C). The final diagnosis was sarcoma.
t: Tumor; v: Vessel.
Reproduced with permission from Citation[56].
![Figure 8. Ultrasound-guided fine-needle puncture. (A–C)t is seen close to a v. Fine-needle aspiration is performed through the duodenal wall. The echo of the puncture needle is seen (arrow) (C). The final diagnosis was sarcoma.t: Tumor; v: Vessel.Reproduced with permission from Citation[56].](/cms/asset/1c389fec-7368-4356-96e1-ae97a5b54cc0/ierd_a_11207343_f0008_b.jpg)